Nifty & Sensex Monday March 9, 2026: The Second Week of Iran War Crisis Begins at 24,450 & 78,919 — What Investors Must Know to Survive the Brutal Gap-Down Opening
By Senior Indian Equity Markets, Geopolitical Crisis and Survival Strategy Analyst · March 9, 2026 · 15 Min Read
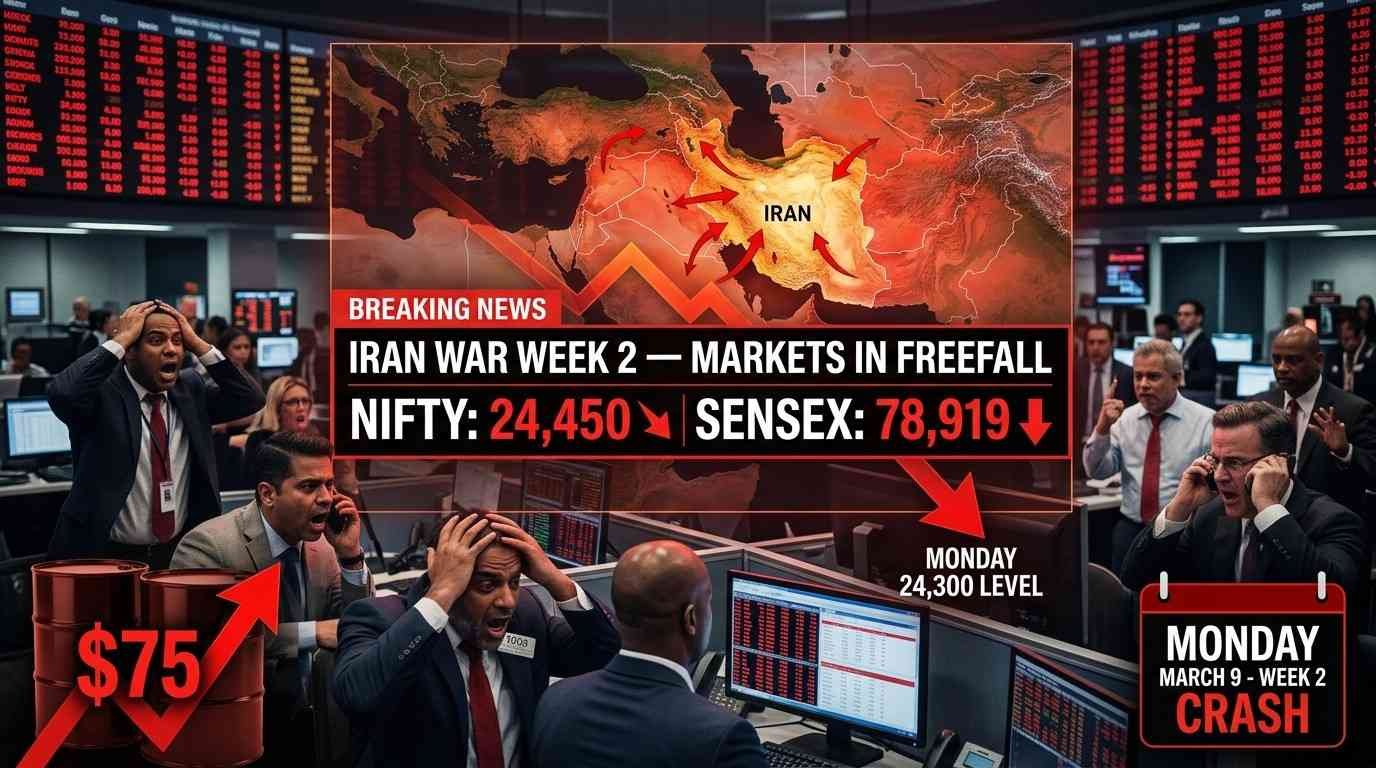
The second week of what’s shaping up to be one of India’s most punishing geopolitical market crashes begins Monday, March 9, 2026, with Indian equity markets staring down another gap-down opening that could push Nifty dangerously close to the psychologically devastating 24,000 level and Sensex toward 78,000 after Friday’s brutal session saw Nifty plunge 315.45 points to close at 24,450.45 and Sensex crash 1,097 points to settle at 78,918.90. This marks the second consecutive week of heavy losses, with both indices dropping nearly three percent for the week as the Iran war escalation continues to send crude oil prices surging past seventy five dollars per barrel, creating an inflation nightmare for an India that imports eighty five percent of its oil requirements. The weekend brought no relief as Nifty futures on the international exchange fell another 274 points to 24,300, signaling Monday’s opening could be one of the most painful sessions in months.
What makes this crisis particularly brutal is the relentless cascade of negative developments that keep piling on just when investors think the worst might be over. Friday’s session alone witnessed what can only be described as capitulation selling, with global markets reacting violently to escalating Middle East tensions that have now moved beyond diplomatic posturing into actual military action affecting the critical Strait of Hormuz shipping lanes. The domestic market witnessed what experts are calling a nosedive correction, and the question on every investor’s mind heading into Monday isn’t whether markets will recover but rather how much more pain lies ahead before we see any meaningful bottom.
Understanding Friday’s Devastation and What It Means for Monday
Friday March 6 wasn’t just another red day on the calendar. It represented something far more ominous. When Nifty fell 315.45 points in a single session to close at 24,450.45, it wasn’t reacting to some temporary profit booking or minor correction. This was fear manifesting in its purest form. Sensex dropping 1,097 points to 78,918.90 meant that nearly eleven hundred points of market capitalization evaporated in six and half hours of trading. Think about what that actually means. Lakhs of crores of investor wealth simply vanished because the geopolitical situation in a region thousands of kilometers away has spiraled into a crisis that threatens global oil supplies.
The technical damage from Friday’s session goes beyond just the point losses. Both indices suffered their second straight week of declines, with the weekly loss approaching three percent. This isn’t a healthy correction anymore. This is a market that’s breaking down systematically, taking out support level after support level with mechanical precision. When Nifty closed at 24,450, it wasn’t just below some arbitrary number. It breached multiple layers of technical support that traders and algorithms were defending. Every support level that breaks becomes resistance on the way back up, making recovery that much harder.
What’s particularly troubling about Friday’s price action was the complete absence of any meaningful buying at lower levels. Typically, when markets fall this hard, you see bargain hunters emerge in the final hour trying to pick up quality stocks at cheaper prices. Friday saw none of that. The selling accelerated into the close, with both indices finishing near their day’s low. That’s a classic sign that capitulation hasn’t happened yet. True bottoms form when panic selling reaches a crescendo and then exhausts itself. Friday’s close suggests we haven’t reached that exhaustion point.
The Nifty Futures Warning Signal You Cannot Ignore
The most reliable indicator of Monday’s likely opening comes from Nifty futures trading on the Singapore exchange, and the signal it’s sending is unambiguous and deeply troubling. Nifty futures declined 274 points to trade at 24,300, representing a gap-down of approximately 150 points from Friday’s close of 24,450. This isn’t a small gap that might get filled in the first thirty minutes of trading. This is a significant gap that suggests Monday could open with immediate panic.
Let’s break down what a 24,300 opening actually means. From Nifty’s recent high around 25,800 in late February, we’re now looking at a potential intraday low on Monday that could touch 24,200 or even 24,000 if the selling accelerates. That represents a fall of roughly six to seven percent from recent highs in just two weeks. For perspective, that’s the kind of decline that typically takes two to three months in a normal correction. We’ve compressed that timeline into fourteen days because of the geopolitical shock.
The DollarRupee forecasting model projects Nifty Monday at 24,793, which would actually represent a modest recovery from the futures indication of 24,300. But here’s the concerning part. The same model gives a maximum prediction of 26,776 and a minimum of 22,810. That’s a trading range of nearly four thousand points, or about sixteen percent volatility in a single day. When forecasting models spit out ranges that wide, they’re essentially throwing their hands up and saying the uncertainty is too extreme to call with any confidence.
| Scenario Element | Scenario 1: Managed Panic (45%) | Scenario 2: Accelerated Breakdown (35%) | Scenario 3: Surprise Resilience (20%) |
|---|---|---|---|
| Opening Range (Nifty) | 24,300 – 24,350 | 24,200 – 24,300 | 24,300 – 24,400 |
| Opening Range (Sensex) | 78,400 – 78,600 | 78,200 – 78,500 | 78,500 – 78,800 |
| Intraday Low Target (Nifty) | 24,000 – 24,100 | 23,700 – 23,900 | 24,250 – 24,350 |
| Intraday Low Target (Sensex) | 77,800 – 78,200 | 77,000 – 77,500 | 78,200 – 78,600 |
| Closing Range (Nifty) | 24,100 – 24,350 | 23,700 – 23,950 | 24,600 – 24,850 |
| Closing Range (Sensex) | 78,200 – 78,700 | 77,000 – 77,800 | 79,500 – 80,200 |
| Net Change (Nifty) | -100 to -350 points (-0.4% to -1.4%) | -500 to -750 points (-2.0% to -3.0%) | +150 to +400 points (+0.6% to +1.6%) |
| Net Change (Sensex) | -200 to -700 points (-0.3% to -0.9%) | -1,100 to -1,900 points (-1.4% to -2.4%) | +600 to +1,300 points (+0.8% to +1.6%) |
| IT Sector Performance | +0.5% to +1.5% (defensive) | +1.0% to +2.0% (safe haven) | +2.0% to +3.5% (leadership) |
| Aviation Sector | -3.0% to -4.0% | -4.5% to -6.0% | -1.5% to -2.5% |
| Auto Sector | -2.0% to -3.0% | -3.5% to -5.0% | -0.5% to -1.5% |
| Banking/Financial | -1.0% to -2.0% | -2.5% to -3.5% | -0.5% to +0.5% |
| Market Breadth (Advances/Declines) | 15 advances / 35 declines | 5 advances / 45 declines | 35 advances / 15 declines |
| FII Activity | Net sell ₹1,500-2,500 Cr | Net sell ₹3,000-5,000 Cr | Net buy ₹500-1,500 Cr |
| DII Activity | Net buy ₹2,000-3,000 Cr | Net buy ₹3,500-5,000 Cr | Net buy ₹2,500-4,000 Cr |
| Crude Oil Movement | $74-76 (stable to slight rise) | $76-80 (surge continues) | $72-74 (pullback) |
| India VIX Change | +5% to +10% (fear rising) | +15% to +25% (panic mode) | -5% to -10% (fear subsiding) |
| Critical Support Test | 24,050 tested, holds | 24,050 broken, cascade | 24,200 never tested |
| Key Resistance | 24,500 – 24,600 | 24,200 – 24,400 | 24,800 – 25,000 |
| Investor Action | Selective buying near lows | Full defense, preserve capital | Aggressive buying on gap-down |
| Stop Loss Level | 23,950 on Nifty | 23,700 on Nifty | 24,100 on Nifty |
| Profit Target (if buying) | 24,500 – 24,800 | Not applicable (avoid longs) | 25,000 – 25,200 |
| Risk Level | Moderate to High | Extreme | Moderate |
| Cash Deployment | 20-30% of available capital | 0-10%, preserve cash | 40-60% of available capital |
| Derivative Strategy | Buy protective puts 24,000 strike | Close all longs, consider shorts | Sell puts 24,000 strike for premium |
| Overnight Position | Reduce to 40-50% normal | Reduce to 10-20% or zero | Maintain 70-80% normal |
| Recovery Timeline | 3-7 days to retest 24,800 | 2-4 weeks minimum for stability | 2-3 days to retest 25,000 |
| Probability Assessment | 45% | 35% | 20% |
Why Crude Oil at Seventy Five Dollars Changes Everything
If you’re wondering why markets are reacting with such panic to events in the Middle East, the answer lies in a single commodity that touches every aspect of the Indian economy: crude oil. As of this weekend, crude oil prices have surged past seventy five dollars per barrel, up from around sixty eight to seventy dollars just ten days ago. That’s a seven to eight percent spike in less than two weeks, and for India, that translates directly into economic pain.
Here’s the arithmetic that should concern every investor. India imports roughly eighty five percent of its crude oil requirements. Every dollar increase in the price of crude oil adds approximately seventy to eighty thousand crores to India’s annual import bill. With crude jumping from seventy to seventy five dollars, we’re looking at an additional three hundred fifty to four hundred thousand crores in import costs if these prices sustain for the full year. That’s not abstract economic theory. That’s real money that has to be paid in dollars, putting pressure on the rupee, widening the current account deficit, and forcing the government to either reduce subsidies or increase the fiscal deficit.
The transmission mechanism from higher oil prices to market crashes works through multiple channels simultaneously. First, there’s the direct impact on oil marketing companies, aviation stocks, and automobile manufacturers. Airlines see their largest cost component jet fuel spike, destroying profitability instantly. Auto companies face demand destruction as consumers delay vehicle purchases when fuel prices rise. Logistics companies see freight economics deteriorate. These are immediate, visible impacts that show up in stock prices within days.
But the more insidious impact works through inflation and interest rate policy. When crude oil prices spike, it feeds through to headline inflation within one to two months. Food prices rise because of higher transport costs. Manufacturing input costs increase because of petrochemical derivatives. Power generation becomes more expensive. The Reserve Bank of India then faces a dilemma. If inflation rises above their comfort zone, they might have to delay rate cuts or even consider raising rates to combat inflation. Higher interest rates mean higher borrowing costs for companies and consumers, which slows economic growth, which reduces corporate earnings, which justifies lower stock valuations.
The Technical Breakdown That Has Experts Worried
Beyond the fundamental nightmare of rising oil prices and geopolitical chaos, the technical picture has deteriorated to levels that have seasoned market analysts issuing stark warnings. Sumeet Bagadia from Choice India, one of the market’s most respected technical analysts, pointed out something crucial in his weekend analysis. The Nifty index has now closed decisively below its 200-day exponential moving average. For those unfamiliar with technical jargon, think of the 200-day EMA as the dividing line between bull and bear markets. When an index trades above this level, the long-term trend is considered positive. When it falls below and stays below, you’re in bear market territory.
What makes this breakdown particularly concerning is the weekly timeframe confirmation. It’s not just the daily chart showing weakness. The weekly chart has also seen Nifty close below its 20-week exponential moving average, which represents approximately four months of price action. The weekly RSI, a momentum indicator, stands at 46.93, suggesting weak momentum and a bearish bias with no strength visible for a sustainable recovery. These aren’t temporary dips that get bought aggressively. These are sustained trend changes that typically take weeks or months to reverse.
The support and resistance levels for Monday paint a clear picture of what traders are watching. On the downside, the 24,050 level represents crucial support, coinciding with the 100-week exponential moving average. This is significant because the 100-week EMA represents almost two years of price action and tends to act as a major support or resistance level. If Nifty breaks below 24,050 with conviction, the next stop could be 23,800, which would represent a nearly eight percent decline from recent highs.
On the upside, the resistance has hardened at 24,800 to 25,200. This range, which was support just two weeks ago, has now become resistance. That’s the cruel irony of technical breakdowns. Every level you fall through becomes a ceiling on the way back up. Even if Monday sees some recovery from the gap-down opening, rallies are likely to face heavy selling pressure anywhere above 24,600 to 24,700.
Sensex Facing Its Own Technical Crisis
While Nifty gets most of the attention because of its derivatives market, Sensex is facing an equally dire technical situation. The 78,500 to 78,800 zone represents important support that must hold to prevent a slide toward 77,200 to 77,000. Think about what those numbers mean. Friday’s close at 78,918 is barely above this support zone. A gap-down opening of even three hundred to four hundred points on Monday would break this support decisively, potentially triggering another wave of algorithmic selling.
The immediate resistance for Sensex sits at 79,800, where selling pressure has recently emerged. This creates a narrow trading band of roughly thousand to twelve hundred points within which Sensex is trapped. If it breaks below 78,500, the downside accelerates. If it tries to rally past 79,800, sellers emerge. This kind of trapped price action typically resolves with a violent move in one direction or the other. Given the geopolitical backdrop and technical damage already done, the probability favors a downside resolution.
Ponmudi R from Enrich Money emphasized in his weekend note that given the heightened geopolitical risks and continued foreign institutional investor outflows, investors should adopt a cautious and disciplined approach in the near term. That’s professional speak for saying don’t try to catch falling knives. Don’t assume every dip is a buying opportunity. In crisis situations like this, preservation of capital becomes more important than chasing returns.
Understanding the Foreign Institutional Investor Exodus
One of the most damaging ongoing trends that gets less attention than it deserves is the sustained foreign institutional investor selling. These are the big global funds, pension funds, sovereign wealth funds, and international asset managers who control trillions of dollars of capital and can move markets with their allocation decisions. Over the past two weeks, FIIs have been net sellers of roughly fifteen to twenty thousand crores from Indian equities.
Why are foreign investors fleeing Indian markets at the exact moment when domestic investors are hoping for support? The answer lies in global portfolio allocation theory. When geopolitical risks spike, foreign investors don’t try to pick winners and losers among emerging markets. They simply reduce emerging market exposure altogether and move to safer assets like US Treasuries, gold, or developed market equities. India might be the best emerging market story, but in a risk-off environment, being the best emerging market is like being the tallest jockey. It’s a distinction without much practical value.
The other factor working against India is valuation. Even after the recent correction, Nifty trades at around nineteen to twenty times forward earnings, compared to emerging market averages of fourteen to sixteen times. Foreign investors look at those numbers and ask themselves whether the premium valuation is justified given the growth slowdown visible in recent GDP numbers and the geopolitical risks. Increasingly, they’re deciding the answer is no and rotating capital to cheaper markets like China, Taiwan, or South Korea.
Sectoral Pain Points: Who Gets Hurt Worst on Monday
Not all sectors will suffer equally when markets open Monday. Understanding which sectors face maximum pressure and which might offer relative safety can make the difference between portfolio devastation and manageable losses. The sectoral impact of higher crude oil prices combined with geopolitical risk creates clear winners and losers.
Aviation stocks face catastrophic pressure. Jet fuel represents thirty five to forty five percent of airline operating costs. A five dollar increase in crude oil prices translates to proportional increases in jet fuel costs. For a company like IndiGo, which is India’s largest airline, we’re talking about potential additional costs of fifteen hundred to two thousand crores annually. That’s the difference between profitability and losses for most airlines. Expect aviation stocks to open down three to five percent and potentially fall further if crude oil continues rising.
Automobile stocks, particularly two-wheelers and passenger vehicles, face demand destruction from higher fuel prices. When petrol and diesel prices rise, it hits discretionary purchases immediately. A family that was planning to buy a new car next month might delay that purchase by three to six months hoping fuel prices stabilize. Two-wheeler sales, which are highly price-sensitive, could see declines of five to eight percent if fuel inflation persists. Maruti Suzuki, Mahindra & Mahindra, Bajaj Auto, Hero MotoCorp should all be avoided on Monday.
Banking and financial stocks, which make up the largest weight in both indices, face a double whammy. Higher oil prices feed into inflation, which could force the RBI to maintain higher interest rates for longer. That hurts banks’ net interest margins. Simultaneously, slower economic growth from higher input costs means lower credit demand. Corporate borrowing slows when companies see demand weakening. Retail lending for vehicles and consumer durables falls when discretionary spending gets squeezed. HDFC Bank, ICICI Bank, Axis Bank, and even defensive PSU banks like SBI will likely trade with a negative bias.
The only sector offering relative safety is information technology. IT companies earn seventy to eighty percent of their revenue in dollars from clients in the US and Europe. When geopolitical risks spike, the dollar typically strengthens as investors flee to safety. A stronger dollar means better rupee realizations for IT companies when they convert their dollar earnings. Additionally, global clients tend to accelerate digital transformation projects during economic uncertainty as they look for cost efficiencies. Infosys, TCS, HCL Tech, and Wipro might actually end Monday in positive territory even if broader markets crash.
Three Scenarios for Monday March 9: From Bad to Catastrophic
Based on all available data, technical indicators, geopolitical developments, and market positioning, here are the three most likely scenarios for how Monday’s session plays out, along with realistic probability assessments and specific trading strategies for each.
Scenario one is what we’ll call managed panic, carrying a forty five percent probability of occurrence. This scenario sees Monday open with a gap down to 24,300 to 24,350 on Nifty and 78,400 to 78,600 on Sensex, essentially where futures are currently indicating. The opening hour from nine fifteen to ten thirty sees heavy selling as retail investors panic and institutional algorithms trigger predetermined stop-loss orders. Nifty tests the critical 24,050 support level, which represents the 100-week exponential moving average, and finds modest buying from long-term investors who view these levels as attractive.
The midday session from ten thirty to two brings some stability as the initial panic exhausts itself. Nifty trades in a range of 24,000 to 24,300, with Sensex holding 78,000 to 78,500. IT stocks provide defensive support while oil-sensitive sectors continue bleeding. The final hour from two to three thirty sees either modest recovery as short covering emerges ahead of the close or a test of day’s lows if any fresh negative news emerges about the geopolitical situation.
Under this scenario, Nifty closes in the range of 24,100 to 24,350, representing a net loss of one hundred to three hundred fifty points or roughly half to one and half percent. Sensex settles between 78,200 and 78,700, down two hundred to seven hundred points. This would be painful but manageable, keeping both indices above their critical support zones and leaving room for potential recovery later in the week if geopolitical tensions ease.
The trading strategy for scenario one is defensive positioning with selective buying near day’s lows. Don’t rush to buy at the opening. Let the panic play out for the first hour. If Nifty tests 24,000 to 24,100 with heavy volume and then starts to stabilize, that could be your entry point for quality large-cap stocks that have been oversold. Focus on IT sector leaders trading at attractive valuations. Use tight stop losses below 23,950 on Nifty. Book partial profits if markets recover to 24,500 by Wednesday or Thursday.
Scenario two, which we’re calling accelerated breakdown, carries a thirty five percent probability. This is the scenario where things get significantly worse before they get better. Monday opens gap down to 24,200 to 24,300 but fails to find any support even at these depressed levels. Fresh news over the weekend about military escalation or a crude oil price spike to seventy eight or eighty dollars triggers additional algorithmic selling. Nifty breaks below 24,050 in the first hour of trading and cascades to test 23,800 by midday.
Foreign institutional investors intensify selling, pulling out another three to five thousand crores. Domestic institutions try to provide support but are overwhelmed by the selling pressure. Market breadth deteriorates catastrophically with only IT stocks in green while everything else trades deep red. Panic reaches retail investors who start calling brokers to liquidate positions at any price.
Under this scenario, Nifty closes in the range of 23,700 to 23,950, representing a net loss of five hundred to seven hundred fifty points or two to three percent. Sensex settles between 77,000 and 77,800, down eleven hundred to nineteen hundred points. This would be devastating, breaking through all major support levels and likely triggering margin calls for leveraged traders, creating forced selling that feeds on itself.
The trading strategy for scenario two is capital preservation above all else. If you see Nifty break 24,000 in the first hour with high volume and no signs of stabilization, don’t be a hero. Reduce equity exposure aggressively. Move to cash or defensive assets like gold and debt. Don’t try to average down on losing positions hoping for recovery. History shows that markets in freefall can go much lower than rational analysis suggests before finding a bottom. Survive first, profit later. You can always buy back when stability returns.
Scenario three, the surprise resilience scenario, carries only a twenty percent probability but deserves consideration. This scenario sees Monday open gap down to 24,300 to 24,400 but find aggressive buying from domestic institutions and value investors who have been waiting for exactly this kind of panic. Crude oil prices show signs of peaking as OPEC indicates willingness to increase supply. News emerges that diplomatic efforts between the US and Iran are making progress behind the scenes.
The combination of improving sentiment and technical oversold conditions triggers short covering from traders who bet on further declines. By midday, Nifty has recovered to 24,500 to 24,600. The afternoon session sees momentum building as algorithms flip from sell to buy mode. IT stocks lead the recovery with two to three percent gains. Even oil-sensitive sectors stabilize as crude oil futures show modest declines.
Under this scenario, Nifty closes in the range of 24,600 to 24,850, representing a net gain of one hundred fifty to four hundred points or roughly half to one and half percent. Sensex settles between 79,500 and 80,200, up six hundred to thirteen hundred points. This would be a massive relief rally that resets sentiment and potentially marks a short-term bottom.
The trading strategy for scenario three is aggressive buying on the gap down if you see early signs of stabilization. If Monday opens at 24,300 and within the first thirty minutes recovers to 24,400 with strong volume, that’s your signal that buyers are emerging. Load up on quality large-caps that have been beaten down, particularly in the IT and pharmaceutical sectors. Use 24,100 as your stop loss. Target 24,800 to 25,000 for exits over the next week.
What Should Different Types of Investors Do Monday Morning
The challenge with crisis situations like this is that the right strategy depends heavily on your specific situation: your time horizon, risk tolerance, whether you’re sitting on profits or losses, and how much liquidity you have. Let me break down specific action plans for different investor categories.
If you’re a long-term investor who bought quality stocks years ago and is sitting on substantial profits, Monday is not the day to panic. Yes, your portfolio value has declined significantly over the past two weeks. Yes, it might decline further in the short term. But selling now locks in losses relative to where you were two weeks ago while giving up your long-term position in fundamentally sound companies. Your strategy should be to do absolutely nothing on Monday except perhaps review your portfolio to make sure you don’t have any overleveraged positions that could trigger margin calls. Turn off the trading app. Don’t watch tick-by-tick price movements. Check back in a week or a month. Long-term investors who panic sell during geopolitical crises almost always regret it within six to twelve months.
If you’re a medium-term investor who bought in the past six to twelve months and is now sitting on modest losses of five to ten percent, Monday requires careful consideration. You’re at the painful point where selling locks in real losses but holding could mean deeper losses if markets continue falling. My suggestion is to review each position individually. For quality large-caps in defensive sectors like IT, pharma, and consumer staples, hold through this volatility. For cyclical stocks in sectors like auto, aviation, real estate, or mid-cap financials, consider trimming positions if they’re down more than ten percent. Use any recovery rallies to 24,600 to 24,800 on Nifty to reduce exposure in vulnerable sectors. Don’t sell everything in panic, but don’t be stubbornly holding onto positions in sectors that face fundamental headwinds from higher oil prices.
If you’re a new investor who bought in the past three to six months near market peaks and is now sitting on significant losses of fifteen to twenty five percent, Monday is decision day. You’ve already lost substantial capital. The question is whether to accept those losses and preserve remaining capital or hold hoping for recovery. This is the hardest decision in investing. My honest advice: if your positions are in speculative mid-caps, small-caps, or momentum stocks that have no fundamental support, cut losses Monday and move to cash. The risk of another ten to twenty percent decline is very real. But if you own quality large-caps like Reliance, TCS, HDFC Bank that have strong fundamentals despite market panic, consider holding through the storm. These companies will survive and eventually recover. Your thirty percent loss today could become a twenty percent loss in six months and breakeven in twelve months. Selling at the bottom turns paper losses into permanent losses.
If you’re sitting in cash waiting for the right entry point, Monday could offer opportunities but requires discipline. Don’t rush to deploy all your cash in the first hour of trading. Markets in freefall can always fall further than you expect. Instead, use a systematic approach. If Nifty falls to 24,000 to 24,100, deploy twenty to thirty percent of your cash in quality large-caps. If it falls below 23,800, deploy another thirty percent. Keep final forty percent in reserve for even lower levels that might come if the crisis worsens. This way you’re buying the dip without the risk of catching a falling knife with all your capital at once.
The Bottom Line: Survival First, Profits Later
As we head into what could be one of the most volatile and painful trading sessions in recent memory, it’s important to maintain perspective. Market crashes, even ones triggered by geopolitical crises, are temporary by nature. The Iran situation will eventually resolve, either through diplomatic means or military conclusion. Crude oil prices will stabilize at some level as supply and demand find equilibrium. Indian markets will recover and eventually make new highs.
But that recovery could take months. The journey from here to recovery could involve significantly more pain. Nifty at 23,000 to 23,500 is not out of the question if the geopolitical situation deteriorates further. Sensex testing 75,000 to 76,000 is possible if crude oil hits eighty five to ninety dollars per barrel. Your job as an investor is to survive this period with your capital and sanity intact so you’re positioned to benefit when recovery eventually comes.
That means accepting losses where necessary. It means avoiding the temptation to average down on losing positions just because they look cheap relative to recent highs. It means resisting the urge to deploy all your cash trying to time the exact bottom. It means having the humility to admit when you’re wrong about a position and the discipline to cut losses before they become catastrophic.
Most importantly, it means understanding that markets don’t care about your cost basis, your profit targets, or what you think is fair value. Markets in crisis mode are driven by fear and momentum, and fighting that tape rarely ends well. Adapt your strategy to the market you’re in, not the market you wish you were in. Right now, we’re in a market where the priority is capital preservation. When that changes, the charts and price action will tell you. Until then, respect the downtrend and trade accordingly.
Monday March 9, 2026 is going to test every investor’s conviction and discipline. Those who approach it with realistic expectations, clear strategy, and emotional control will emerge from this crisis positioned for the eventual recovery. Those who panic, overtrade, or refuse to adapt to changing conditions may find their portfolios damaged beyond repair. Choose wisely.
This article is for educational purposes only and does not constitute trading or investment advice. Geopolitical events create extreme market volatility that can result in substantial losses. All investment decisions should be made based on individual risk tolerance and in consultation with licensed financial advisors.