Nifty & Sensex March 25, 2026: The 1,300-Point Relief Rally That Saved Portfolios — Why Tuesday’s Surge to 22,958 & 74,068 May Not Signal Bottom Despite
By Senior Indian Equity Markets, Geopolitical Crisis and Technical Analysis Strategist · March 25, 2026
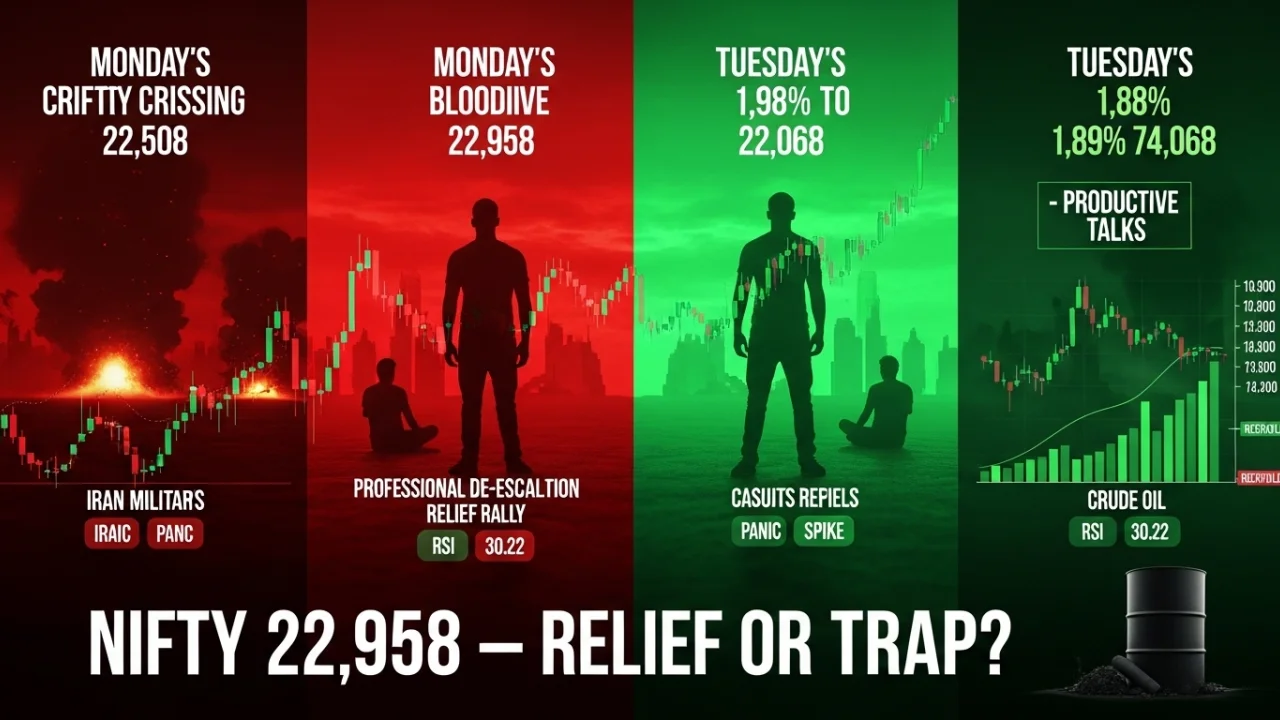
Indian equity markets delivered one of their most dramatic single-day recoveries in months on Tuesday March twenty fourth, with Nifty exploding one point nine eight percent higher to close at 22,957.80 after touching an intraday high of 23,057, while Sensex surged one point eight nine percent to settle at 74,068.45 recovering nearly half of Monday’s catastrophic 1,836-point crash that had pushed both indices into correction territory. The catalyst for this euphoric relief rally was President Donald Trump’s late Monday announcement that he would postpone planned US strikes on Iran’s power and energy infrastructure by five days following what he described as productive conversations with Tehran, creating temporary hope that the Middle East conflict might de-escalate rather than spiral into full-scale regional war.
Yet beneath Tuesday’s celebratory surface lurks the uncomfortable reality that Nifty remains down nearly thirteen percent from its all-time high of 26,373, Bank Nifty has crashed thirteen point five percent from peak levels and is trading below the critical 54,000 support for the fourth consecutive week, and India VIX volatility remains elevated signaling continued market uncertainty despite the relief bounce. The critical question facing investors Wednesday morning is whether Tuesday’s 1,300-point combined Sensex-Nifty rally marks a genuine turning point establishing Monday’s lows at 22,512 Nifty and 72,696 Sensex as the bottom, or whether this represents merely a classic dead cat bounce before markets resume their downtrend toward the 22,000 to 21,500 zone that technical analysts warn could materialize if crude oil sustains above ninety eight dollars per barrel or if Iran tensions reignite after the five-day postponement window closes.
The Four-Week Massacre: How We Got Here
Understanding Tuesday’s relief rally requires first comprehending the magnitude of destruction that preceded it. Nifty has now closed in the red for four consecutive weeks, shedding 1,299 points or five point three one percent just in the week ending March twenty first, bringing the cumulative decline from the January all-time high to approximately 3,400 points representing a thirteen percent correction that officially meets the technical definition of a market correction. This isn’t just a healthy pullback or normal profit-booking, this is a systematic breakdown of market structure where each support level gets violated with mechanical precision.
Table 1: Nifty & Sensex Weekly Carnage – Four Consecutive Red Weeks
| Week Ending | Nifty Opening | Nifty Close | Weekly Change | Sensex Opening | Sensex Close | Weekly Change | Key Catalyst |
|---|---|---|---|---|---|---|---|
| March 7 | ~24,800 | 24,450.50 | -350 pts (-1.4%) | ~80,200 | 79,255 | -945 pts (-1.2%) | Iran war begins |
| March 14 | 24,450 | 23,757 | -693 pts (-2.8%) | 79,255 | 76,963 | -2,292 pts (-2.9%) | Crude spikes $110+ |
| March 21 | 23,757 | 23,151.10 | -606 pts (-2.5%) | 76,963 | 75,012 | -1,951 pts (-2.5%) | Strait Hormuz closure |
| March 28 (partial) | 23,151 | 22,957.80 | -193 pts (-0.8%) | 75,012 | 74,068.45 | -944 pts (-1.3%) | Trump postpones strike |
| Cumulative Loss | — | — | -1,843 pts (-7.4%) | — | — | -5,187 pts (-6.5%) | Four-week selloff |
This table reveals the relentless selling pressure that has gripped markets since early March when the Iran crisis erupted. Every attempt at recovery has been met with renewed selling, creating a stair-step pattern lower that has systematically destroyed investor confidence and portfolio values. The weekly RSI now stands at an oversold 30.22, reflecting near-capitulation conditions, yet price action continues making lower lows suggesting technical indicators alone cannot call the bottom.
Bank Nifty’s performance has been even more devastating, crashing from above 62,000 in January to current levels around 53,400, representing a nearly fourteen percent decline. More ominously, Bank Nifty broke decisively below the critical 54,000 level and the 100-week exponential moving average, technical violations that typically signal sustained bear market conditions requiring months not weeks to repair.
Tuesday’s Relief Rally: The Numbers Behind the Bounce
When markets opened Tuesday morning following Trump’s Iran strike postponement announcement, the relief was immediate and violent. Nifty gapped up approximately 350 to 400 points from Monday’s close of 22,512, opening around 22,890 and immediately pushing toward the psychologically important 23,000 level. The morning session saw continued buying as short positions established during Monday’s panic were frantically covered and bargain hunters emerged betting the worst was over.
By midday, Nifty had surged to an intraday high of 23,057, briefly crossing above 23,000 and recovering roughly 545 points or two point four percent from Monday’s low. Sensex followed an identical trajectory, rallying from Monday’s close of 72,696 to touch intraday highs near 74,500 before profit-taking emerged. The final hour of trading saw some giveback from peak levels as traders booked partial profits, with Nifty ultimately settling at 22,957.80 up 1.98 percent and Sensex closing at 74,068.45 up 1.89 percent.
The sectoral performance told the story of relief unwinding in perfect reverse of Monday’s panic. Financials which had crashed over three percent Monday rebounded sharply with HDFC Bank gaining 2.9 percent, ICICI Bank up 1.6 percent, and the banking index recovering over two percent. Heavyweight stocks that had dragged indices lower Monday led the recovery Tuesday, with Larsen & Toubro surging 5.25 percent, IndiGo jumping nearly four percent as jet fuel cost nightmares dissipated with crude oil retreating from peak levels, and Eternal Limited posting gains above five percent.
Even sectors that typically lag during relief rallies participated Tuesday. IT stocks which had provided defensive support Monday continued holding gains with HCL Tech and Tech Mahindra posting modest advances. Auto stocks recovered as fears of 120 rupee per liter petrol evaporated with crude falling back toward ninety eight dollars. The advance-decline ratio improved dramatically from Monday’s devastation, though the quality of the rally remained questionable given elevated India VIX and lack of follow-through above 23,000 resistance.
The Five-Day Window: Hope or False Dawn
President Trump’s announcement that strikes on Iran’s power grid would be postponed five days creates a narrow window during which markets must determine whether diplomatic progress is genuine or whether this represents merely tactical delay before inevitable military escalation. The five-day timeframe means the postponement window closes around March twenty ninth or thirtieth, creating a hard deadline after which uncertainty returns with full force if no breakthrough emerges.
Market participants are interpreting the postponement through multiple lenses. Bulls view it as evidence that diplomatic channels remain open, Iran is willing to negotiate despite public posturing, and the conflict can potentially be resolved without further military action that would push crude oil back toward the catastrophic 110 to 118 dollar range seen at recent peaks. This optimistic interpretation supports buying at current 22,900 to 23,000 levels anticipating recovery toward 23,800 to 24,000 over the next two weeks as geopolitical premium unwinds.
Bears counter that five-day postponement is tactically meaningless, simply delaying inevitable confrontation while allowing both sides to reinforce positions and prepare for escalation. They note that Iran has given no indication of backing down on Strait of Hormuz threats, US military assets continue building in the region, and crude oil at ninety eight dollars despite the postponement suggests physical markets don’t believe the crisis is over. This bearish interpretation argues for selling any rally toward 23,000 to 23,200 expecting resumed downtrend toward 22,000 to 21,500 once the five-day window expires without genuine breakthrough.
Critical Technical Levels That Will Determine the Path
From a pure technical analysis perspective, Tuesday’s price action through close presents both encouraging signals and concerning red flags that will determine whether the rally extends or fails over the coming sessions.
Table 2: Nifty & Sensex Critical Technical Levels for March 25-28
| Index | Current Level | Immediate Support | Strong Support | Critical Support | Immediate Resistance | Strong Resistance | Breakout Level |
|---|---|---|---|---|---|---|---|
| Nifty | 22,957.80 | 22,850-22,900 | 22,650 | 22,500-22,400 | 23,000-23,057 | 23,400 | 23,800 |
| Sensex | 74,068.45 | 73,700-73,800 | 73,200 | 72,700-72,200 | 74,500-74,700 | 75,400 | 76,500 |
| Bank Nifty | ~53,400 | 53,100-53,200 | 52,500 | 51,400-51,000 | 53,800-54,000 | 54,700 | 55,500 |
| RSI | Rising | 35-40 zone | — | 30 oversold | 45-50 | 55-60 | Above 60 |
| Crude Oil | $98.42 | $95-96 | $90-92 | $85-88 | $100-102 | $105-108 | Above $110 |
What These Levels Mean for Wednesday:
The immediate resistance at 23,000 to 23,057 for Nifty represents Tuesday’s intraday high and a psychological barrier that must be cleared for the rally to gain credibility. Bajaj Broking specifically notes that “a strength above Tuesday high (23,057) will open further pullback towards 23,400 and 23,800 levels in the coming sessions,” making this the critical near-term hurdle. If Nifty cannot reclaim and hold 23,000 on Wednesday, it suggests Tuesday was merely short covering and profit-taking will resume pushing prices back toward 22,650 to 22,500.
On the downside, support at 22,850 to 22,900 represents the opening zone from Tuesday. If this level fails Wednesday, it would create a lower high after Tuesday’s bounce, a classic technical signal that the uptrend is failing and the broader downtrend remains intact. The critical support at 22,500 to 22,400 coincides with Monday’s low and represents the absolute line in the sand. A decisive break below 22,400 would likely trigger cascade toward 22,000 psychological support and potentially 21,500 to 21,800 zone that Choice India analysts identify as the next major demand area.
Bank Nifty faces its own critical test at the 54,000 level which it broke below during recent sessions. Bajaj Broking notes that Bank Nifty “need to form higher high and higher low on a sustained basis and closed above the 54,700 levels to signal a pause in the downward trend,” suggesting recovery requires not just one good day but sustained buying over multiple sessions to confirm reversal.
What Investors Should Actually Expect Wednesday
Your Wednesday strategy depends entirely on whether you believe Tuesday’s rally represents capitulation bottoming or dead cat bounce before deeper correction. Most importantly, recognize that the five-day Trump postponement window creates artificial calm that may evaporate violently when the deadline passes without diplomatic breakthrough.
If you panic sold Monday near the lows at 22,500 to 22,700, resist the temptation to chase Tuesday’s rally at 22,900 to 23,000. Wait for either pullback to 22,650 to 22,750 for re-entry in quality large caps, or wait for decisive breakout above 23,400 before committing capital. Buying at Tuesday’s highs after selling Monday’s lows is the classic retail investor mistake that destroys wealth through whipsaw.
If you held through Monday’s carnage without selling, congratulations on surviving the test but don’t celebrate prematurely. Use any Wednesday strength above 23,000 to book partial profits on positions bought well below current levels. Trail stop losses up to 22,700 to protect against resumed downside. Do not assume Tuesday’s bounce confirms the bottom, it merely creates opportunity to reduce risk at better prices than Monday offered.
If you are sitting in cash waiting for clarity, Wednesday offers a binary setup. If Nifty opens strong and pushes above 23,057 with volume in the first hour, that confirms continuation of Tuesday’s bounce and justifies deploying twenty to thirty percent of intended allocation targeting 23,400. If Nifty opens flat to negative and fails to hold 22,900, that signals Tuesday was short covering and you should wait for deeper correction toward 22,200 to 22,400 before buying.
The brutal reality is we are in a market where geopolitical developments trump fundamentals, technicals, and valuations. The five-day postponement window creates temporary relief but no certainty. Trade accordingly with reduced position sizes, tight stops, and recognition that both the 24,000 recovery scenario and 21,500 breakdown scenario remain possible depending on developments nobody can predict with confidence.
This article is for educational purposes only and does not constitute investment advice. Markets remain highly volatile during geopolitical uncertainty. All decisions should be based on individual risk tolerance.
Data: Goodreturns, Choice India, Bajaj Broking, Enrich Money, 5paisa, Trading Economics as of March 24-25, 2026.