
Common Investing Mistakes to Avoid as a Beginner: 15 Costly Errors That Destroy Wealth (And How to Fix Them)
By Senior Financial Markets Educator and Behavioral Finance Analyst · February 21, 2026 · 10 Min Read
Ninety percent of beginner investors lose money not because markets are rigged or investing is inherently risky — but because they repeat the same fifteen catastrophic mistakes that have destroyed portfolios for decades. A 2023 SEBI study found that 89% of individual equity traders lost an average of ₹1.1 lakh over three years, while disciplined SIP investors in the same period gained 35-40% returns. That divergence is not luck — it is the mathematical consequence of specific, predictable errors that beginners make when fear, greed, and ignorance collide with volatile markets. So what are the exact mistakes that separate the 10% who build generational wealth from the 90% who lose capital — and how do you avoid becoming another statistic?
Mistake #1: Panic Selling During Market Corrections (The Wealth Destroyer)
This is the single most expensive mistake beginners make — and it destroys more wealth than any market crash ever could.
What Happens:
You invest ₹5 lakh in January when Nifty is at 26,000. By March, Nifty falls to 23,000 (12% correction — normal market behavior). Your portfolio shows ₹4.4 lakh. You panic, thinking “I’ll lose everything if I don’t sell now” and exit at ₹4.4 lakh, locking in ₹60,000 loss.
By July, markets recover to 26,500. Your ₹5 lakh would be worth ₹5.1 lakh if you had held. Instead, you locked in permanent loss and missed the recovery.
Real Data:
| Market Event | Nifty Peak | Nifty Bottom | Fall % | Recovery Time | Return if Held |
|---|---|---|---|---|---|
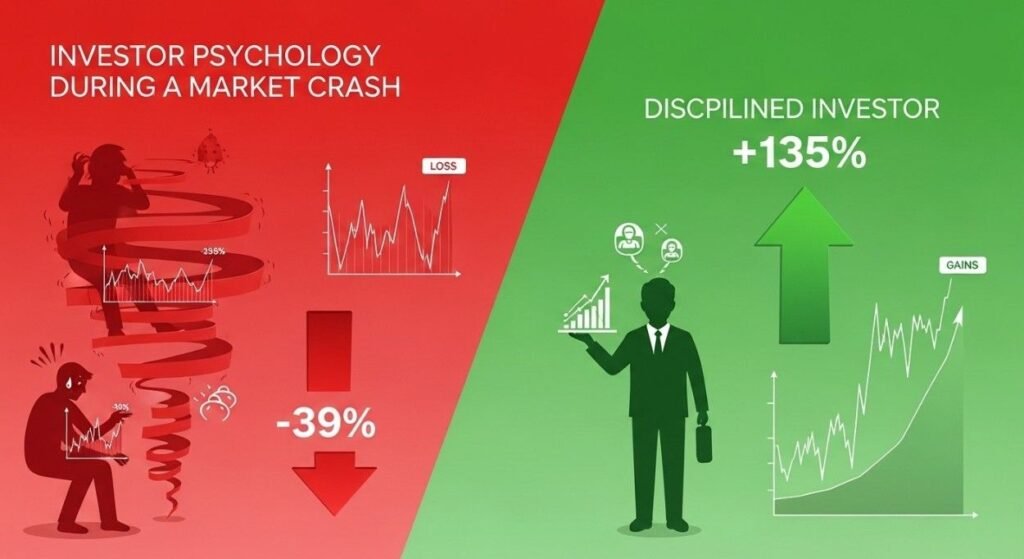
| COVID Crash (Mar 2020) | 12,362 | 7,511 | -39% | 5 months | +135% to Feb 2026 |
| 2008 Financial Crisis | 6,357 | 2,252 | -65% | 3 years | +285% to 2020 peak |
| 2011 Debt Crisis | 6,338 | 4,531 | -28% | 2 years | +120% to 2020 |
| 2013 Taper Tantrum | 6,415 | 5,119 | -20% | 18 months | +110% to 2020 |
Every single time markets crashed in history, they recovered and reached new highs. Investors who sold during panic locked in permanent losses. Investors who held or added during crashes made the highest returns.
The Psychology:
Humans are wired for loss aversion — the pain of losing ₹10,000 is psychologically 2x more intense than the pleasure of gaining ₹10,000. When you see portfolio in red, your brain screams “DANGER! SAVE WHAT YOU CAN!” This is evolution protecting you from predators — but it destroys investment returns.
How to Avoid:
- Expect 2-3 corrections of 10-15% every year — this is not crisis, it is market breathing
- Never check portfolio daily — quarterly reviews reduce emotional decisions by 60%
- Automate through SIP — if money deducts automatically, you can’t panic-sell
- Set sell rules in advance: “I will only sell if company fundamentals deteriorate (fraud, bankruptcy risk), NEVER because price fell”
- Remember this fact: Since 1980, Nifty has fallen 10%+ from peak approximately 37 times. It recovered every single time.
Mistake #2: Trying to Time the Market Perfectly
Beginners waste months or years waiting for the “perfect entry point” or trying to sell before crashes and buy before rallies — a strategy that has failed professional fund managers for decades.
What Happens:
- March 2025: “Markets are too high, I’ll wait for correction”
- July 2025: “They went higher! Now I’ll definitely wait”
- October 2025: “Finally a 5% dip — but it might fall more, I’ll wait”
- January 2026: Markets hit new highs — you’re still in cash, missed entire 18% rally
The Data That Should Terrify Market Timers:
A Morningstar study found that investors who missed just the 10 best days in the Nifty 50 over 20 years saw their returns cut from 12% annually to 5.8% — barely above FD returns. The problem? Those 10 best days usually occur within weeks of the worst days, making it mathematically impossible to catch rallies without enduring crashes.
| Investment Strategy | 20-Year Return (CAGR) | ₹10 Lakh Becomes |
|---|---|---|
| Fully Invested (Never Sold) | 12.0% | ₹96.5 lakh |
| Missed 10 Best Days | 5.8% | ₹30.8 lakh |
| Missed 20 Best Days | 2.1% | ₹15.2 lakh |
| Missed 30 Best Days | -0.8% | ₹8.5 lakh (LOSS) |
The Psychology:
Recency bias makes you believe recent patterns will continue forever. Markets up 6 months straight? “It will keep rising.” Markets down 3 months? “It will keep falling.” Both assumptions are usually wrong at precisely the moment you act on them.
How to Avoid:
- Start SIP regardless of market level today — data proves time IN market beats timing THE market
- If you have lumpsum, invest in 3-6 monthly tranches — splits timing risk without waiting forever
- Set calendar, not price targets: “I will invest ₹50,000 on 1st of every month” — not “I will invest when Nifty touches 24,500”
- Accept this truth: You cannot time markets. Warren Buffett cannot. Your broker cannot. Nobody can consistently.
Mistake #3: Lack of Diversification (Putting All Eggs in One Basket)
What Happens:
“Reliance is India’s biggest company and my friend made ₹2 lakh in it. I’ll put my entire ₹5 lakh savings in Reliance only.”
Then Reliance faces regulatory issues, oil prices crash, or management makes strategic error. Stock falls 30% in 6 months. Your entire portfolio is -30% with no other holdings to offset the loss.
Real Concentration Risk Examples:
- Yes Bank (2020): Investors with concentrated positions lost 80-90% when the bank collapsed
- Kingfisher Airlines (2012): Complete wipeout — stock went to ₹0
- Adani Group (Jan 2023): Fell 50-60% in days — concentrated portfolios destroyed
- Paytm (2024-2025): Down 75% from IPO — those who put entire IPO allocation suffered
Proper Diversification Framework:
| Diversification Level | Number of Stocks | Risk Reduction | Recommended For |
|---|---|---|---|
| Poor | 1-3 stocks | 0-20% | Nobody — extremely risky |
| Inadequate | 4-7 stocks | 30-50% | Not recommended |
| Minimum | 8-12 stocks | 60-70% | Active investors with time |
| Good | 15-20 stocks | 80-85% | Direct stock investors |
| Excellent | 30-50 stocks (mutual fund) | 90%+ | Best for beginners |
But Also Avoid Over-Diversification:
Owning 50+ stocks directly (not through mutual fund) creates “diworsification” where you cannot track all holdings, and returns dilute toward market average while management effort explodes.
Sector Diversification Matters Too:
Don’t buy 10 bank stocks thinking you’re diversified. 2018 banking crisis proved this — IL&FS crisis hit all banks simultaneously, destroying “diversified” banking-only portfolios.
Proper Sector Allocation:
- Banking/Finance: 20-25%
- IT Services: 15-20%
- FMCG/Consumer: 10-15%
- Energy/Utilities: 10-15%
- Auto/Manufacturing: 10-15%
- Pharma/Healthcare: 10-15%
- Others: 10-15%
How to Avoid:
- Use index funds/Nifty 50 funds for instant 50-stock diversification — zero effort
- If buying direct stocks, minimum 10 different companies across 5+ sectors
- Never let single stock exceed 15% of portfolio — rebalance if it grows beyond this
- Never let single sector exceed 30% of portfolio
- Review sector allocation quarterly — tech rallies can make IT 40% of portfolio without you noticing
Mistake #4: Chasing Past Performance (Buying What’s Already Rallied)
What Happens:
You see news: “XYZ Smallcap Fund delivered 85% return in 2025 — best performer!” You immediately invest ₹3 lakh in January 2026. By December 2026, the fund is -15% while other funds gain 12%. You bought at the peak after the rally had already happened.
The Data on Performance Chasing:
SPIVA India Scorecard shows that funds in the top quartile (best 25%) rarely stay there next year. In fact, only 12% of top quartile funds remained in top quartile the following year. Past performance is literally not an indicator of future results — yet it is the #1 factor beginners use to select funds.
| Fund Performance Persistence Study | Year 1 Top Quartile | Still Top Quartile Year 2 | Still Top Quartile Year 3 |
|---|---|---|---|
| Reality | 100 funds | 12 funds (12%) | 3 funds (3%) |
| If Skill-Based | 100 funds | 65-75 funds expected | 50-60 funds expected |
| Conclusion | Performance is largely luck-driven short-term |
Real Example — Small Cap Fund Trap (2024-2025):
Small cap funds delivered 40-60% returns in 2024. Media headlines screamed “BEST PERFORMING CATEGORY.” Beginners poured ₹45,000 crore into small cap funds in Q4 2024 and Q1 2025 at peak valuations. By mid-2025, small caps corrected 25-30%, and those investors faced heavy losses while early investors who entered in 2022-2023 still had gains.
Why This Happens:
- Recency bias: Recent performance feels more important than long-term track record
- FOMO (Fear of Missing Out): “Everyone is making money, I need to get in NOW”
- Media amplification: Headlines only celebrate winners after the rally is complete
How to Avoid:
- Look at 3-year, 5-year, 10-year returns — not last year
- Compare fund to its benchmark index: Fund returned 18% but Nifty returned 20%? That’s underperformance despite positive return
- Check consistency: Fund that delivers 12-14% every year beats fund that delivers 40% one year and -10% next year
- Use rolling returns, not point-to-point: Eliminates lucky single-year performance
- Default to index funds if you cannot evaluate quality: Nifty 50 index fund beats 65% of active funds over 10 years
Mistake #5: Not Having Clear Investment Goals (Aimless Investing)
What Happens:
You invest ₹10,000 monthly “to make money” without defining what the money is for, when you need it, or how much is enough. When markets fall 15%, you panic-sell because you have no anchor keeping you invested. When they rise 30%, you’re unsure whether to book profits or stay invested.
The Problem with “Investing to Make Money”:
It creates no discipline, no timeline, no accountability. Every market move feels like a decision point. Should I sell now? Should I buy more? The confusion leads to random, emotional decisions that destroy returns.
Proper Goal-Based Investing Framework:
| Goal | Timeline | Risk Tolerance | Ideal Investment | Monthly SIP Needed |
|---|---|---|---|---|
| Emergency Fund | 0-1 year | Zero | Liquid fund, FD | ₹10,000 for 6 months |
| House Down Payment | 3 years | Low | Debt funds, gold | ₹40,000 for ₹15L target |
| Child Higher Education | 15 years | High | Equity mutual funds | ₹8,000 for ₹50L target |
| Retirement Corpus | 25 years | High | 100% equity index funds | ₹15,000 for ₹2 Cr target |
| Buying Car | 2 years | Low | Debt funds, FD | ₹25,000 for ₹6L target |
How Goals Change Behavior:
- Child education in 15 years: 20% market fall doesn’t scare you because you have 15 years to recover
- House down payment in 2 years: You correctly avoid equity and use debt funds — capital preservation matters more than growth
- Retirement in 25 years: You aggressively invest during crashes knowing you have decades to benefit
How to Avoid:
- List every financial goal with specific amount and timeline
- Calculate required monthly investment for each goal using SIP calculators
- Open separate investment accounts/folios for each goal — mental accounting prevents raiding retirement savings for vacations
- Review annually: Goals change (marriage, children, job change) — adjust investments accordingly
- Use goal-based investing apps: Kuvera, ETMoney Goal SIP features automate this
Mistake #6: Investing Before Building Emergency Fund
What Happens:
You invest entire ₹3 lakh savings into stocks/mutual funds. Three months later, medical emergency requires ₹80,000. Markets are down 12% — selling means locking in ₹9,000 loss. You’re forced to sell at the worst time or take expensive personal loan at 14% interest.
The Vicious Cycle:
No emergency fund → Unexpected expense → Forced to sell investments at loss → Miss market recovery → Returns permanently destroyed → Discouraged, stop investing
Proper Financial Structure (In This Order):
| Priority | Step | Action | Amount |
|---|---|---|---|
| 1st | Emergency Fund | High-interest savings/liquid fund | 6 months essential expenses |
| 2nd | Health/Life Insurance | Term insurance + health insurance | Adequate coverage |
| 3rd | High-Interest Debt | Clear credit cards, personal loans | All consumer debt |
| 4th | Short-Term Goals (<3yr) | Debt funds, FD | Goal-specific amounts |
| 5th | Long-Term Investment | Equity mutual funds, stocks | Remaining savings |
How Much Emergency Fund:
Calculate monthly essential expenses (rent, food, utilities, EMIs, insurance) × 6 months
Example:
- Rent: ₹15,000
- Food/groceries: ₹8,000
- Utilities: ₹3,000
- Insurance: ₹2,000
- EMIs: ₹12,000
- Total monthly: ₹40,000
- 6-month emergency fund: ₹2,40,000
Where to Keep Emergency Fund:
- Not in: Stocks, equity mutual funds (too volatile)
- Not in: Fixed deposits (lock-in period, penalties)
- Good: High-interest savings account (IDFC First, RBL, AU Small Finance)
- Better: Liquid mutual funds (1-day redemption, 6-7% returns)
- Best: Split 50/50 between instant-access savings and liquid fund
How to Avoid:
- Build 6-month emergency fund BEFORE investing in equity — this is non-negotiable
- Keep it completely separate — different bank account, mental label “DO NOT TOUCH”
- Replenish after use: Used ₹50,000 for emergency? Pause equity SIP temporarily and rebuild emergency fund first
- Review annually: Expenses rise — ₹2.4L fund in 2024 needs to be ₹2.6L in 2026
Mistake #7: Following Stock Tips from Friends, Family, WhatsApp Groups
What Happens:
Your uncle’s friend: “ABC penny stock will double in 3 months, insider info, 100% guaranteed!” You invest ₹50,000 without researching. Stock falls 60% in 2 months. “Insider” was pump-and-dump scheme operator.
The Mathematics of Tip-Based Investing:
SEBI research found that 89% of individual stock traders lost money averaging ₹1.1 lakh over 3 years. The vast majority were following tips rather than doing fundamental research. Meanwhile, disciplined SIP investors in diversified funds gained 35-40% in the same period.
Real Tip Scam Examples:
- Pump-and-Dump Schemes: Operators accumulate penny stock at ₹10 → Spread “tips” via WhatsApp → Gullible investors buy, price rises to ₹30 → Operators dump at ₹30 → Stock crashes to ₹5 → Retail investors lose 83%
- Telegram Paid Groups: Promise “guaranteed returns” → Take ₹5,000-10,000 membership fees → Give random tips → Disappear when tips fail → Victims too embarrassed to report
- “Research Analyst” Scams: Fake SEBI registration, professional-looking reports → Actually affiliated with companies they promote → Get paid to pump stocks
Why Tips Fail:
- Information asymmetry: If tip was genuinely profitable, why would they share instead of using it themselves?
- Timing lag: By the time tip reaches you, smart money already acted and is preparing to exit
- No accountability: Tip-giver loses nothing if you lose money
- Confirmation bias: People remember one successful tip, forget ten failed tips
How to Avoid:
- NEVER invest based solely on tips — use tips only as “stocks to research,” not buy signals
- Verify SEBI registration: Real research analysts have SEBI registration number — verify on SEBI website
- Ask for logic: “Why will this stock rise?” If answer is vague “good company” or “big rally coming” — red flag
- Check financial statements yourself: Download annual report, read quarterly results — if you can’t understand business, don’t invest
- Default rule: If you cannot explain why you’re buying a stock to a 10-year-old in simple terms, do NOT buy it
- Report scams: Forward pump-and-dump WhatsApp messages to SEBI investor complaints portal
Mistake #8: Overtrading and Excessive Portfolio Churning
What Happens:
You buy Stock A on Monday. By Thursday it’s up 3% — you sell to “book profits.” Friday you buy Stock B. Next week sell at 2% gain. Monthly brokerage + STT + GST + taxes = ₹15,000 on ₹5 lakh portfolio (3% annual cost). Returns eroded before even accounting for losses.
The Cost of Overtrading:
| Trading Frequency | Annual Transactions | Transaction Costs | Tax Burden | Net Return Impact |
|---|---|---|---|---|
| Buy & Hold | 2-4 per year | 0.1-0.2% | LTCG 12.5% | -0.3% |
| Moderate Trading | 15-20 per year | 0.5-1.0% | STCG 20% | -2% to -3% |
| Active Trading | 100+ per year | 2-4% | STCG 20% + STT | -5% to -8% |
| Day Trading | 500+ per year | 5-10% | STCG 20% + STT | -10% to -20% |
SEBI study: 89% of individual traders lost money. Average loss: ₹1.1 lakh over 3 years. Primary cause: excessive trading costs and short-term capital gains tax eating into marginal profits.
Why Beginners Overtrade:
- Illusion of control: Trading makes you feel active and in control (but mostly creates losses)
- Boredom: Holding investments for years feels boring — trading provides excitement
- Small gains addiction: Booking ₹2,000 profit feels good even though you miss ₹20,000 gain over next 6 months
- Broker incentives: Trading apps send notifications, show “opportunities” — they profit from your transactions
Real Example — Buy & Hold vs. Trading:
Investor A (Buy & Hold):
- Buys HDFC Bank at ₹1,400 in Jan 2023
- Holds through volatility
- Sells at ₹1,575 in Feb 2026 (38 months later)
- Gain: 12.5% + dividends ~2% = 14.5% total
- Tax: LTCG on ₹175 gain = ₹21.87 (12.5%)
- Net gain: ₹153/share on ₹1,400 investment = 10.9% net return
Investor B (Active Trader):
- Buys HDFC Bank ₹1,400 in Jan 2023
- Sells at ₹1,430 in Feb 2023 (+2.1% gross)
- Buys back ₹1,445 in March 2023
- Sells ₹1,475 in April 2023 (+2% gross)
- Repeats this 15 times over 38 months
- Average gross gain per trade: 2%
- Transaction costs per trade: 0.3%
- Net per trade: 1.7%
- STCG tax: 20% on gains
- Net gain after 15 round trips: 4.2% total vs. 10.9% buy & hold
How to Avoid:
- Set minimum holding period: 12 months minimum — forces LTCG tax benefit
- Limit portfolio churn to 20-30% annually — sell only if fundamentals deteriorate
- Calculate all-in costs before trading: Brokerage + STT + GST + taxes + stamp duty + DP charges
- Disable trading app notifications — reduces impulse trading
- Use separate “trading” vs. “investment” accounts — keep 90% in long-term investment account, only 10% in active trading
Mistake #9: Ignoring Fees, Expenses, and Tax Implications
What Happens:
You invest in “regular” mutual fund through advisor. Expense ratio: 2.5% annually. After 20 years your ₹10 lakh investment at 12% gross returns becomes ₹64 lakh. With direct fund at 0.8% expense ratio, same investment becomes ₹84 lakh. You lost ₹20 lakh to fees you didn’t pay attention to.
The Fee Impact Over Time:
| Fund Type | Expense Ratio | ₹10L Invested for 20 Years @ 12% Gross | Final Corpus | Fee Cost |
|---|---|---|---|---|
| Direct Index Fund | 0.10% | ₹10 lakh → ₹95.5 lakh | ₹95.5 lakh | ₹1.2 lakh |
| Direct Equity Fund | 0.80% | ₹10 lakh → ₹84.1 lakh | ₹84.1 lakh | ₹12.6 lakh |
| Regular Equity Fund | 2.00% | ₹10 lakh → ₹67.3 lakh | ₹67.3 lakh | ₹29.4 lakh |
| Regular + Exit Load | 2.50% | ₹10 lakh → ₹64.1 lakh | ₹61 lakh | ₹35.7 lakh |
That 1.7% difference in expense ratio (Direct vs. Regular) costs you ₹23 lakh over 20 years.
Other Hidden Costs:
- Exit Load: 1% fee if you sell mutual fund before 1 year (some funds before 3 years)
- STT (Securities Transaction Tax): 0.1% on equity sales — seems small but compounds
- GST: 18% on brokerage fees
- Stamp Duty: 0.015% on buy side
- DP Charges: ₹5-20 per stock sold from Demat account
Tax Mistakes:
- Short-term churn: Selling before 12 months = 20% STCG vs. 12.5% LTCG — 7.5% penalty
- Not harvesting losses: If you have ₹50,000 capital gains and ₹20,000 unrealized losses — sell losing positions to offset gains, reducing tax by ₹2,500
- Forgetting ₹1.25L exemption: First ₹1.25 lakh LTCG is tax-free annually — spread sales across years to maximize
How to Avoid:
- Always choose Direct funds over Regular — 1-2% annual savings compounds massively
- Use discount brokers: Zerodha/Groww charge ₹0-20 per trade vs. traditional brokers ₹50-500
- Hold investments minimum 12 months for LTCG tax benefit
- Harvest tax losses annually in December — offset gains
- Prefer index funds (0.1% expense) over active funds (1-2% expense) unless active fund consistently outperforms
Mistake #10: Leverage Trading and Margin Abuse
What Happens:
You have ₹1 lakh. Broker offers 5x margin trading — you buy ₹5 lakh worth of stocks. Stock falls 10% → Your ₹5 lakh becomes ₹4.5 lakh → You owe broker ₹4 lakh but collateral only worth ₹4.5 lakh → Margin call → Forced liquidation → You lose ₹50,000 (50% of your capital) on 10% market move.
Real Margin Trading Disaster Examples:
- 2020 COVID Crash: Investors using 3-5x leverage saw -30% market fall become -100% portfolio wipeout + debt to broker
- 2008 Crisis: Margin traders not only lost entire capital but owed additional money to brokers
- Individual cases: SEBI has documented cases of investors losing ₹50 lakh on ₹10 lakh capital through margin abuse
The Mathematics of Leverage:
| Market Move | No Leverage (₹1L invested) | 3x Leverage (₹3L position) | 5x Leverage (₹5L position) |
|---|---|---|---|
| +10% Rally | +₹10,000 (10%) | +₹30,000 (30%) | +₹50,000 (50%) |
| -10% Fall | -₹10,000 (10%) | -₹30,000 (30%) | -₹50,000 (50%) |
| -20% Fall | -₹20,000 (20%) | -₹60,000 (60%) | -₹1,00,000 (WIPEOUT) |
| -30% Fall | -₹30,000 (30%) | -₹90,000 + margin call | Debt to broker |
Why Beginners Fall for Leverage:
- Greed: “If I can 5x my gains, I’ll get rich faster”
- Broker marketing: Apps prominently display margin available, making it seem normal
- Survivorship bias: Friend made ₹50,000 using margin (you don’t hear about ten friends who lost capital)
- Overconfidence: Beginner luck in first few trades creates illusion of skill
How to Avoid:
- NEVER use margin for beginners — wait minimum 3-5 years of investing experience
- Even experienced investors: Limit leverage to 1.5x maximum — never 3-5x
- Use margin only for brief tactical positions, never long-term holdings
- Understand this truth: Leverage magnifies losses far more painfully than it magnifies gains due to loss aversion psychology
- If you lost money using margin: STOP immediately, close position, never use again until you fully understand risk
Key Takeaways
→ Panic selling during market corrections destroys more wealth than any crash — investors who sold during COVID -39% fall missed the +135% recovery, locking in permanent losses while buy-and-hold investors gained 2-3x returns.
→ Trying to time perfect market entries is mathematically impossible — missing just 10 best days over 20 years cuts returns from 12% to 5.8% annually, reducing ₹10 lakh to ₹30.8 lakh instead of ₹96.5 lakh.
→ Lack of diversification creates catastrophic concentration risk — Yes Bank, Kingfisher Airlines, Adani Group examples prove single-stock betting can wipe out entire portfolios; minimum 10-15 stocks across 5+ sectors required.
→ Chasing past performance fails because only 12% of top-quartile funds stay top-quartile next year — performance is largely luck short-term; default to index funds that beat 65% of active funds over 10 years.
→ Investing without emergency fund forces you to sell during crashes at worst prices — build 6-month essential expenses in liquid fund BEFORE putting any money in equity markets.
→ Following WhatsApp/friend tips loses money 89% of the time per SEBI study averaging -₹1.1 lakh over 3 years — tip-givers profit from your losses in pump-and-dump schemes; do your own research or use mutual funds.
→ Overtrading and ignoring fees destroys returns — regular mutual fund 2% expense ratio costs ₹29 lakh on ₹10 lakh invested over 20 years vs. ₹1.2 lakh cost for 0.1% direct index fund; always choose direct funds.
→ Leverage trading amplifies losses catastrophically — 5x margin turns -20% market fall into -100% portfolio wipeout plus debt to broker; beginners should NEVER use margin for minimum 3-5 years.
This article is for educational purposes only and does not constitute investment advice. All investment decisions should be made based on individual financial goals, risk tolerance, and in consultation with a SEBI-registered investment advisor.
Information compiled from SEBI research, Morningstar studies, SPIVA India Scorecard, market data, and investor behavior analysis as of February 2026.