Crude Oil Price March 2026: $119 to $88 Wild Ride — What to Expect Next
Crude Oil Price March 2026: The $119 to $88 Whipsaw — Why WTI’s Historic 35.6% Weekly Gain Cannot Prevent the Coming Crash Back to $60 or Rally to $150
By Senior Energy Markets, Geopolitical Risk and Commodity Volatility Analyst · March 12, 2026
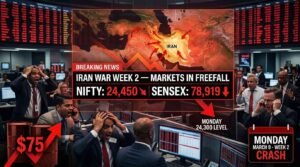
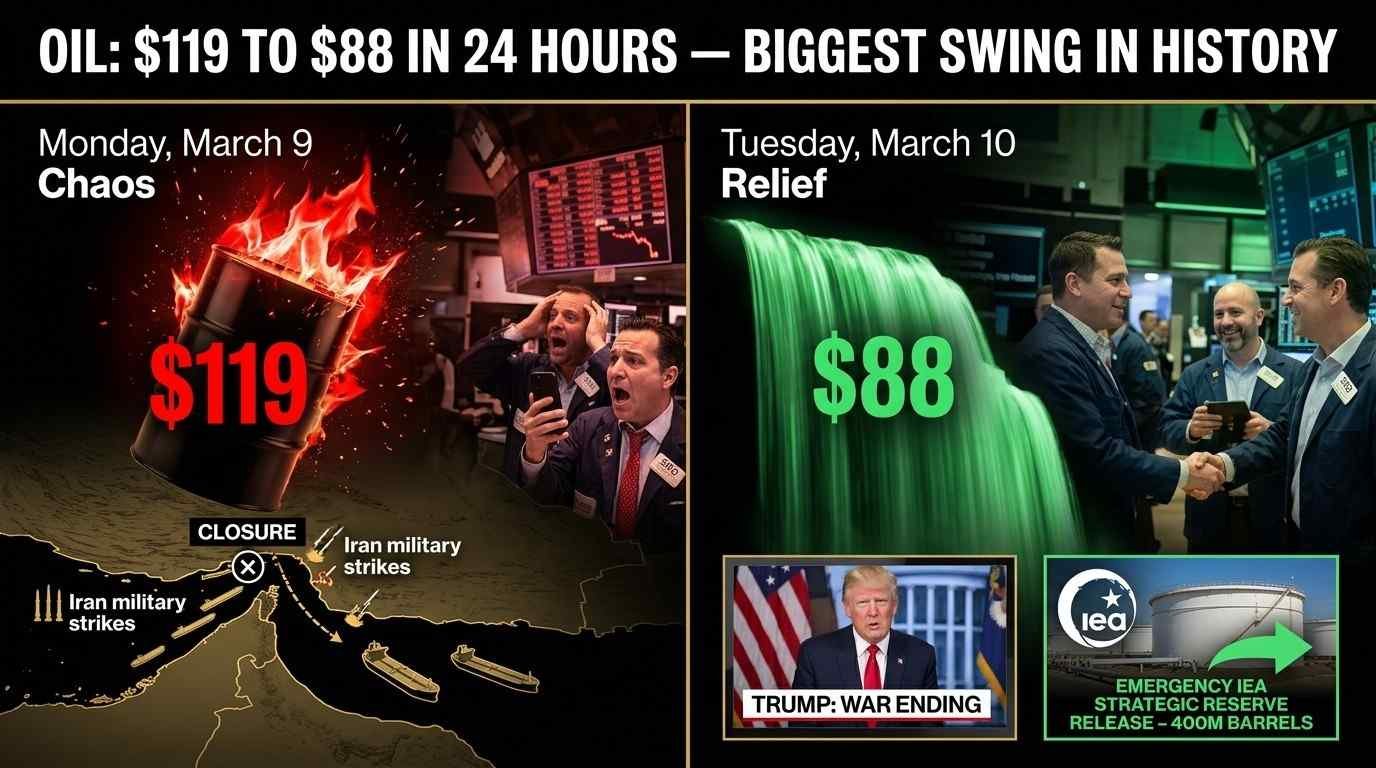
Crude oil has transformed from the most boring commodity of early 2026 into the most violently volatile asset class on planet Earth, with West Texas Intermediate posting its largest weekly gain in the entire history of oil futures trading dating back to 1983 by surging thirty five point six three percent in just five trading days, while Brent crude touched an intraday peak of one hundred nineteen dollars fifty cents per barrel Monday March ninth before collapsing in the most dramatic reversal ever witnessed to eighty eight dollars Tuesday March tenth as President Trump’s social media signals that the Iran war may end soon triggered the single largest twenty four hour crude oil price decline of over thirty dollars that has left every major investment bank scrambling to rewrite their 2026 forecasts. This schizophrenic price action perfectly captures the impossible situation facing energy markets in mid-March 2026: physically trapped with the Strait of Hormuz effectively closed and removing twenty percent of global oil supply from accessible markets while simultaneously oversupplied with inventories building and production capacity sitting idle in the United States, Canada, and Brazil waiting to flood markets the moment geopolitical premiums evaporate.
The central question confronting oil traders, airline CFOs planning fuel hedges, central bankers worried about inflation, and equity investors watching their portfolios get crushed by energy cost fears is whether crude oil’s path forward leads toward Goldman Sachs’ base case forecast of seventy six dollars per barrel for second quarter 2026 gradually declining to seventy one by fourth quarter and eventually sixty dollars in 2027, or whether the war premium persists and drives prices toward the one hundred thirty five to one hundred fifty dollar nightmare scenario that Qatar’s energy minister warned could bring down the economies of the world. Understanding which outcome materializes requires analyzing both the physical supply disruption that is undeniably real with Iraq shutting one point five million barrels per day of production and Kuwait cutting output as storage reaches capacity, and the fundamental oversupply dynamics that had J.P. Morgan forecasting fifty eight dollar oil before the war began.
The Monday Massacre: When Oil Touched $119 and Markets Panicked
Let me reconstruct exactly what happened during the twenty four hours from Monday March ninth morning through Tuesday March tenth afternoon because the magnitude of price movement represents one of the most violent commodity swings in modern financial history and provides crucial lessons about how geopolitical premiums work. Monday opened Asian trading with Brent crude immediately gapping higher to above one hundred dollars per barrel from Friday’s close around eighty three to eighty five dollars, representing a fifteen to seventeen dollar overnight jump that reflected weekend news of massive US-Israeli airstrikes across Iran targeting oil refineries and depots including the devastating attack on the Shahran oil refinery in northwestern Tehran that left numerous fuel tankers and vehicles unusable.
But that opening gap-up proved to be just the beginning of Monday’s parabolic surge. Instead of profit-taking emerging at one hundred dollars psychological level, buying accelerated throughout the Asian and European sessions as physical oil traders realized the Strait of Hormuz was not just threatened but effectively closed with Iran’s Revolutionary Guard commander declaring the strait shut and threatening to set fire to any ship attempting passage. By late morning European time, Brent had surged past one hundred ten dollars. By midday, it touched one hundred fifteen. The intraday high of one hundred nineteen dollars fifty cents came during afternoon London trading, representing a thirty four to thirty six dollar gain from Friday’s close or roughly forty percent in less than seventy two hours.
West Texas Intermediate followed an identical trajectory, hitting an intraday peak of one hundred nineteen dollars forty eight cents before settling Monday around one hundred two dollars, while Brent closed the session at one hundred three dollars forty seven cents. These closing prices represented gains of eleven point six percent for Brent and twelve point two percent for WTI in a single session, the kind of one-day moves typically reserved for small-cap penny stocks not the world’s most liquid commodity markets trading hundreds of billions of dollars daily volume. The panic driving these prices wasn’t speculation or algorithmic trading gone haywire. It was genuine fear from physical buyers who needed actual barrels of oil to refine into gasoline, diesel, and jet fuel and were willing to pay any price to secure supply.
The human impact of Monday’s oil spike materialized within hours. US gasoline prices jumped twenty seven cents per gallon in one week to three dollars twenty five cents according to AAA data, with prices in California approaching four dollars fifty cents and some stations in high-cost areas already crossing five dollars. Diesel surged even more dramatically, approaching four dollars nationally and devastating the economics of trucking companies whose fuel costs represent thirty to forty percent of operating expenses. Airlines faced catastrophic margin pressure with jet fuel costs spiking in lockstep with crude, threatening quarterly losses of hundreds of millions of dollars for carriers like United and Delta despite strong passenger demand.
The Tuesday Miracle: How Crude Crashed $30 in 24 Hours
Then came Tuesday March tenth and the most violent crude oil reversal that veteran energy traders claim they have never witnessed in thirty-plus year careers. The catalyst was President Donald Trump’s late Monday night social media post on Truth Social declaring that the Iran war may come to an end soon and warning Iran that blocking oil supply from the Strait of Hormuz would result in them being hit twenty times harder. This combination of diplomatic olive branch with credible military threat created immediate shift in market psychology from panic to cautious relief.
Asian markets Tuesday morning opened with crude oil futures gapping down dramatically. Brent which had closed Monday at one hundred three dollars opened Tuesday around ninety five to ninety eight dollars, immediately erasing five to eight dollars. But the selling accelerated rather than stabilized as algorithmic trading systems and commodity trading advisors who had built massive long positions betting on continued upside scrambled to exit before the collapse accelerated. By midday Tuesday Asian time, Brent had crashed through ninety dollars. By early European trading, it touched eighty eight dollars, representing a collapse of over thirty one dollars from Monday’s one hundred nineteen dollar fifty cent peak or roughly twenty six percent in less than twenty four hours.
Wednesday March eleventh brought modest recovery as markets digested the whipsaw and tried to find equilibrium. Brent rallied four point seven six percent to close at ninety one dollars ninety eight cents per barrel while WTI gained four point five five percent to eighty seven dollars twenty five cents. This Wednesday recovery suggested markets were attempting to settle into a trading range around ninety to ninety five dollars that balanced the still-real physical disruption of Strait of Hormuz closure against the possibility that diplomatic resolution could come within weeks rather than months.
The International Energy Agency’s announcement Wednesday that member countries agreed to release a record four hundred million barrels of oil from strategic petroleum reserves represented the largest coordinated emergency supply release in IEA history and provided the fundamental cushion preventing crude from rebounding back toward one hundred dollars. The United States contributing the bulk of this release essentially told markets that even if Strait of Hormuz remains closed for another month, enough oil would flow from strategic stockpiles to prevent supply shortage and economic collapse.
The Fundamental Oversupply That Everyone Forgot
What makes crude oil’s March 2026 rally so confusing for long-term investors is that just four weeks ago every major energy analyst on Wall Street was predicting structural oversupply that would drive prices toward fifty eight to sixty dollars per barrel. The U.S. Energy Information Administration, J.P. Morgan Global Research, and Goldman Sachs all published bearish forecasts in late January and early February citing global liquid fuel supply growth outpacing demand growth by comfortable margins that should build inventories and pressure prices lower throughout 2026.
The fundamental case for sub-sixty dollar oil rested on three pillars that have not changed despite the war. First, global oil demand growth in 2026 is projected at just nine hundred thirty thousand barrels per day according to the International Energy Agency, representing anemic growth barely above one percent that reflects slowing economic activity in China, structural efficiency gains in transportation, and accelerating electric vehicle adoption cutting into gasoline consumption. Second, global oil supply growth is projected to exceed demand growth led by United States shale production continuing to expand, Guyana bringing massive new offshore fields online, and Brazil increasing output from pre-salt discoveries. Third, OPEC-plus production cuts that supported prices in 2024 and 2025 are gradually unwinding with the cartel planning to add two hundred six thousand barrels per day starting April 2026.
These fundamental dynamics created J.P. Morgan’s base case forecast of Brent averaging sixty dollars per barrel for full year 2026, Goldman Sachs initially targeting sixty six dollars for fourth quarter before recent upward revision, and the EIA projecting fifty seven dollars sixty nine cents annual average. All three institutions acknowledged that their forecasts assumed no major sustained supply disruption from geopolitics, and that assumption obviously failed when Iran war shut the Strait of Hormuz. But the critical point is that the fundamental oversupply condition has not disappeared just because geopolitics temporarily overwhelmed it.
Goldman Sachs Raises Targets But Still Sees $71 by Year-End
Goldman Sachs’ latest forecast revision published March twelfth provides the most sophisticated framework for understanding where crude prices go from current ninety to ninety five dollar levels. The bank raised its second quarter 2026 Brent forecast by ten dollars to seventy six dollars per barrel and Q2 WTI by nine dollars to seventy one, reflecting expectations that reduced Strait of Hormuz shipments will produce significant OECD inventory drawdowns during March and April. Goldman also raised fourth quarter forecasts to seventy one dollars Brent and sixty seven WTI from previous sixty six and sixty two, acknowledging that disruption will last longer than initially modeled.
The bank’s revised base case now assumes twenty one days of low Strait of Hormuz oil flows at just ten percent of normal levels followed by thirty day gradual recovery, compared to earlier expectation of ten day disruption. This extended timeline matters enormously because every additional week of reduced flows means millions more barrels drawn from inventories or cut from production. Goldman assumes IEA member states will not fully release the four hundred million barrel commitment because logistical constraints limit draws to three million barrels per day maximum, and releases will phase out through early June when WTI prices moderate to low seventies.
Critically, Goldman’s forecast assumes Strait of Hormuz flows start recovering March twenty first onward, meaning we are essentially at the inflection point right now in mid-March. If diplomatic progress materializes over the next week and tanker traffic begins resuming by March twenty first to twenty fifth as Goldman models, then crude’s path is down from current ninety to ninety five toward seventy six in Q2, seventy one in Q4, and eventually sixty by 2027 as fundamental oversupply reasserts itself. But if the war continues beyond March and Strait remains closed into April and May, Goldman’s forecasts become obsolete and the one hundred thirty five to one hundred fifty dollar nightmare scenario enters realistic probability.
The $60 Baseline vs $150 War Premium: Two Parallel Realities
Energy markets in mid-March 2026 are simultaneously pricing two completely contradictory realities that cannot both be true but neither can be dismissed. The first reality is the physical fundamental picture where global inventories are building, production capacity sits idle waiting to be activated, and demand growth remains anemic. In this reality, crude oil’s fair value is somewhere between fifty eight and seventy dollars per barrel, and every dollar above seventy represents temporary geopolitical premium that will evaporate when Strait of Hormuz reopens and normal shipping resumes.
The second reality is the geopolitical supply shock where twenty percent of global oil supply is physically inaccessible, Middle East producers are shutting production because storage is full and they have nowhere to send barrels, and the risk of further escalation toward Saudi facilities or UAE infrastructure could remove another five to ten million barrels per day from markets. In this reality, crude oil’s equilibrium price is one hundred to one hundred fifty dollars reflecting genuine scarcity, and any price below one hundred represents irrational complacency about war duration and impact.
Which reality prevails depends entirely on one variable: how long the Strait of Hormuz remains effectively closed to commercial tanker traffic. If it reopens within the next ten to fourteen days as Goldman Sachs base case assumes, the fifty eight to seventy dollar fundamental reality wins and crude crashes from current ninety to ninety five toward seventy over the next two months. If it remains closed for another month or two because war continues or Iran maintains blockade even after ceasefire, the one hundred to one hundred fifty dollar geopolitical reality wins and we have only seen the beginning of the energy crisis.
What Investors and Consumers Should Actually Expect
Your personal crude oil outlook and investment strategy depends on which scenario you assign higher probability and how you want to position for the uncertainty. Let me provide frameworks for different stakeholder groups trying to navigate this volatility.
For airline investors and executives, the critical decision is whether to hedge fuel costs at current ninety to ninety five dollar levels or wait hoping for decline toward seventy. The conservative approach is hedging fifty percent of projected Q2 and Q3 fuel consumption at ninety to ninety five using futures or options, accepting that you might overpay if prices fall to seventy but protecting against catastrophe if they rebound to one hundred twenty. The aggressive approach is staying unhedged betting on Strait reopening and price collapse, but this could bankrupt airlines if war continues another two months.
For equity investors watching portfolios get crushed by energy cost inflation fears, the question is whether to rotate into energy stocks or stay in technology and healthcare defensives. Energy stocks like Exxon, Chevron, and ConocoPhillips will print massive windfall profits if crude sustains above ninety dollars for another quarter, making them potential outperformers. But if crude crashes to seventy by June as Goldman forecasts, these stocks will give back all gains and underperform. The middle ground is maintaining normal sector weights rather than making aggressive overweight or underweight bets when the outcome is genuinely fifty-fifty.
For central bankers and policymakers, the nightmare is that crude oil above ninety dollars feeds into headline consumer price index inflation within six to eight weeks, forcing interest rate increases despite weak economic growth. The Federal Reserve, European Central Bank, and Reserve Bank of India all have inflation mandates that require tightening policy if sustained energy price increases threaten price stability. Markets are already pricing reduced probability of rate cuts in 2026, and if crude stays elevated through May and June, rate hikes could come back on the table destroying equity valuations.
For everyday consumers facing gasoline above three dollars twenty five and diesel approaching four dollars, the unfortunate reality is prices will likely stay elevated through April and possibly May before declining. Even if Strait reopens soon, it takes four to six weeks for lower crude prices to fully flow through the refining and distribution chain to retail pump prices. The best advice is cutting discretionary driving, carpooling where possible, and avoiding panic buying that creates artificial local shortages.
The bottom line is crude oil at ninety to ninety five dollars per barrel in mid-March 2026 is neither cheap enough to buy aggressively nor expensive enough to short aggressively. It is fairly valued for maximum uncertainty, and trading direction from here depends entirely on geopolitical developments that are impossible to predict with confidence. Respect the volatility, manage risk appropriately, and recognize that both the sixty dollar fundamental baseline and one hundred fifty dollar war premium remain possible over the next three to six months.
This article is for educational purposes only and does not constitute investment or trading advice. Crude oil markets involve extreme volatility and geopolitical risks. All investment decisions should be made based on individual circumstances and risk tolerance.
Data: CNBC, Goldman Sachs, U.S. EIA, J.P. Morgan, Reuters, Bloomberg, IEA, Capital.com