Suzlon Hits 52-Week Low at ₹43.85: What Should Investors Do Now?
Suzlon Hits 52-Week Low at ₹43.85: Down 41% From Peak — Here’s What Investors Should Do Now
By Senior Indian Equity Markets and Renewable Energy Sector Analyst · February 24, 2026 · 12 Min Read
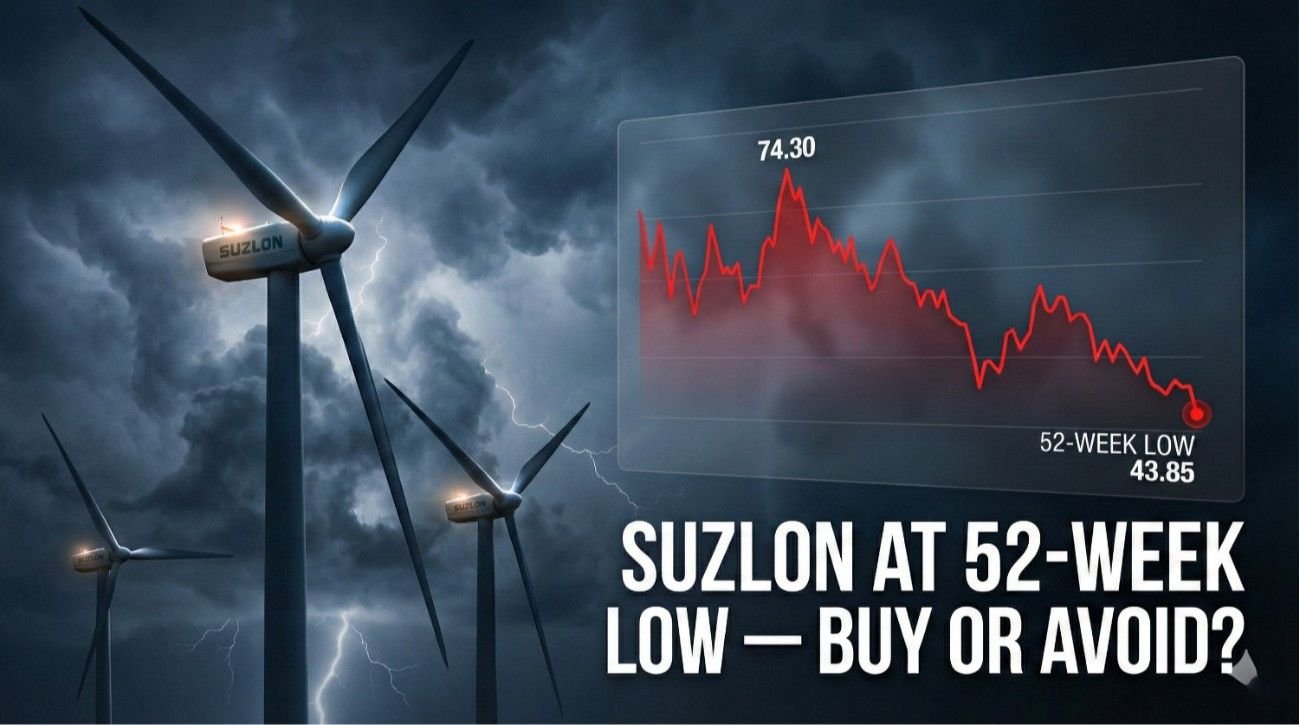
Suzlon Energy’s brutal descent from multibagger darling to 52-week low catastrophe encapsulates one of 2026’s most punishing sector corrections — a renewable energy stock that delivered 816% returns over five years and surged to ₹74.30 in May 2025 has now crashed 41% to hit ₹43.85-44.26 on February 20-23, 2026, erasing ₹20+ lakh crore in market capitalization despite posting strong Q3 results with net profit up 15% to ₹445 crore and revenue jumping 42% to ₹4,228 crore. The stock trades below all major moving averages (5-day through 200-day), technical indicators scream “sell,” and even a ₹9.6 crore Chennai customs penalty announced February 19 has piled on the misery. Yet beneath this wreckage lies a company with zero debt, 6.4 GW order book (up from 5.6 GW last fiscal), 30% India wind market share, and analyst median targets at ₹64.50 (+45% from current levels). So should investors capitulate and sell at 52-week lows accepting losses — or is this the generational buying opportunity value investors dream about?
The Brutal Facts: How Far Suzlon Has Fallen
| Metric | Current (Feb 20-24, 2026) | Peak/Historical | Change |
|---|---|---|---|
| Current Price | ₹44-46 range | — | Trading at 52-week low |
| 52-Week High | ₹74.30 | May 2025 | -40.8% |
| 52-Week Low | ₹43.85 | Feb 23, 2026 | Current level |
| 2026 YTD Performance | -13% to -16% | — | Painful start |
| 6-Month Performance | -23% to -24% | — | Accelerating decline |
| 1-Year Performance | -15.6% to -18.98% | — | Underperformance |
| Market Cap | ₹60,000-62,700 Cr | — | Down from ₹1+ lakh Cr peak |
| 5-Year Returns | +816% | — | Long-term still strong |
| Distance from All MAs | Below all | Trading below 5/10/20/50/100/200 day | Complete breakdown |
The Speed of Collapse:
What makes Suzlon’s fall particularly devastating is the velocity — the stock lost 40% in just 9 months (May 2025 to February 2026). This isn’t gradual profit-taking; it’s systematic liquidation suggesting either:
- Fundamental deterioration investors see that hasn’t been disclosed
- Sector rotation out of renewable energy into AI/tech
- Technical breakdown triggering algorithmic selling
- Valuation reset from bubble pricing to realistic levels
The February 20-23 period saw Suzlon hit new lows on three consecutive sessions:
- Feb 20: ₹44.46 (touched ₹44.26 intraday)
- Feb 21: ₹44.24
- Feb 23: ₹43.85 (new absolute low)
Each successive low attracted selling rather than buying — a classic sign that capitulation has not yet occurred.
Why Did Suzlon Crash? The Five Catalysts Behind the Carnage
Catalyst #1: Chennai Customs Penalty Creates Immediate Selling Pressure
On February 19, 2026, Suzlon disclosed that Chennai customs slapped its now-merged unit (Suzlon Global Services) with a ₹9.6 crore penalty for alleged shortfalls in IGST (Integrated Goods and Services Tax) payments on imports.
Why This Matters More Than the Amount:
The ₹9.6 crore penalty is immaterial for a company with ₹4,228 crore quarterly revenue and ₹445 crore quarterly profit. But it signals:
- Regulatory scrutiny: Customs authorities may be examining other transactions
- Corporate governance concerns: Were proper import duty calculations in place?
- Hidden liabilities: Is this the first of multiple penalties?
- Management distraction: Resources diverted to legal battles instead of growth
Suzlon says it will appeal, but the uncertainty created immediate selling on February 20 when the stock dropped 1.75% to ₹44.46 and touched ₹44.26 intraday — the 52-week low at that time.
Catalyst #2: Complete Technical Breakdown Below All Moving Averages
Suzlon trades below every major moving average:
- 5-day MA: ₹46.5 (immediate resistance)
- 20-day MA: ₹47.0 (short-term resistance)
- 50-day MA: ₹48.5 (medium-term resistance)
- 100-day MA: ₹51.5
- 200-day MA: ₹54.0 (long-term support failed)
What This Technical Carnage Means:
When a stock trades below its 200-day moving average, it signals a long-term downtrend where every rally faces selling pressure. The current setup shows:
- Lower highs, lower lows: Classic downtrend pattern since September 2025
- MACD below zero line: Momentum deeply negative
- DI- above DI+: Selling pressure dominating buying interest
- RSI not oversold: Still room to fall further before technical bounce
Technical analysts from SBI Securities note: “The stock remains in a clear downtrend marked by consistent lower low-lower high price structure. Price trading below key moving averages reinforces negative undertone.”
Catalyst #3: Sector-Wide Renewable Energy Correction
Suzlon isn’t alone — the entire Indian renewable energy sector faces headwinds:
| Stock | Peak | Current | Decline | Reason | |—|—|—|—| | Suzlon | ₹74.30 | ₹44-46 | -40% | Wind energy execution delays | | Inox Wind | — | Weak | -30%+ | Same sector pressures | | IREDA | High | Corrected | -20%+ | Lending to stressed sector | | NTPC Green | Launch high | Below issue | Disappointing | High valuations unsustainable | | Waaree Energies | Post-IPO high | Corrected | -15-25% | Solar module pricing pressure |
Why Renewable Sector Correcting:
- Execution delays: Projects taking longer than expected
- Margin compression: Rising input costs (steel, copper, rare earths)
- Grid connectivity: Delays in transmission infrastructure bottleneck capacity
- Subsidy uncertainty: Government policy changes create revenue risk
- Valuation reset: Sector traded at 60-100x P/E ratios (unsustainable)
Catalyst #4: Profit-Taking After 816% Five-Year Rally
While the recent decline is brutal, zoom out and Suzlon has still delivered 816% returns over five years (from ₹5-6 levels in 2021 to current ₹44-46). Many long-term investors are:
- Booking profits: Exit after 8x-10x gains
- Rebalancing portfolios: Suzlon became 20-30% of portfolios for early buyers
- Tax harvesting: Lock in long-term capital gains before year-end
This systematic selling from winners — combined with no new buyers willing to enter at current levels — creates relentless downward pressure.
Catalyst #5: Concerns About Valuation Despite Strong Results
Suzlon’s Q3 results were objectively strong:
- Net profit: ₹445 crore (+15% YoY)
- Revenue: ₹4,228 crore (+42% YoY)
- EBITDA: ₹730.5 crore (+48% YoY)
- EBITDA margin: 17.3% (up 70 bps)
Yet the stock fell. Why?
The Valuation Disconnect:
Even at ₹44, Suzlon trades at:
- P/E ratio: 29-37x (sources vary) — expensive for cyclical industrial
- P/B ratio: 5.35-13.98x — extremely high for capital-intensive business
- EV/EBITDA: ~25x (estimated) — premium to global wind peers
Compare to:
- Vestas (Denmark): 15-20x P/E
- Siemens Gamesa (Spain): 20-25x P/E
- GE Renewable Energy: 18-22x P/E
Suzlon’s premium Indian valuation appears unjustified, especially given:
- No dividend (0% yield)
- Capital-intensive business requiring continuous investment
- Execution risk on large projects
- Dependence on government policies
The Bullish Case: Why This Could Be the Bottom
Despite the technical carnage and negative sentiment, three fundamental strengths suggest Suzlon at ₹43-46 could represent value:
Strength #1: Order Book Growth to 6.4 GW (Record High)
Suzlon’s closing order book reached 6.4 GW in Q3 FY26 — higher than the opening order book despite record deliveries during the quarter. This means:
- Fresh orders exceeded deliveries: Demand remains strong
- Visibility extended: 6.4 GW provides 15-18 months of revenue visibility
- Quality clients: NTPC Green, BPCL, ArcelorMittal Nippon Steel, Sunsure Energy
- S144 turbine dominance: 91% of order book is flagship S144 platform
Recent Major Wins:
- ArcelorMittal Nippon Steel: 248.85 MW project in Gujarat (part of 550 MW hybrid)
- Marks fourth major order for green steel production
- Total contribution to green steel capacity: 1,156 MW in India
The order book growth is the single most important bullish indicator — it means the business fundamentals are intact even as the stock crashes.
Strength #2: Zero Debt Balance Sheet (Financial Fortress)
Suzlon’s debt-to-equity ratio: ZERO
This is extraordinary for a capital-intensive manufacturing business. It means:
- No interest burden: All profits flow to equity shareholders
- Financial flexibility: Can invest in R&D, capacity expansion without lender constraints
- Survival certainty: Even if revenue/profit falls 50%, company won’t face bankruptcy
- Acquisition capacity: Can buy distressed competitors using stock or cash
Compare to:
- Inox Wind: Leveraged balance sheet
- Most infrastructure/industrial companies: 0.5-2.0x D/E ratios
Suzlon’s zero debt is result of aggressive deleveraging over 2020-2024, transforming it from bankruptcy risk to financial stability.
Strength #3: Operating Leverage Driving Profit Growth
| Metric | Q3 FY26 | Growth Rate |
|---|---|---|
| Net sales growth (annual) | — | 39.30% |
| Operating profit growth (annual) | — | 55.82% |
| ROCE (6-month period) | 28.23% | Exceptional |
| Institutional ownership | 32.97% | High conviction |
The 55.82% operating profit growth versus 39.30% revenue growth demonstrates operating leverage — as revenue scales, profit grows faster due to fixed cost absorption. This suggests:
- Margin expansion runway: Can reach 20%+ EBITDA margins at scale
- Earnings CAGR potential: 25-35% over 3-5 years if execution continues
- Multiple re-rating catalyst: Market may re-rate stock when consistent 20%+ margins achieved
Strength #4: India Wind Capacity Addition Accelerating
Government targets:
- 2030 target: 140 GW wind capacity (vs. current ~45 GW)
- Gap to fill: 95 GW over next 4 years = 24 GW annually
- Suzlon market share: 30% = ~7 GW annual addressable market
Even if Suzlon captures 20-25% (conservative), that’s 5-6 GW annual additions — nearly matching current 6.4 GW order book. The runway extends through 2030+.
The Bearish Case: Why Further Downside is Possible
Risk #1: Technical Breakdown Not Complete
Technical analysts warn the pain may not be over:
Sudeep Shah (SBI Securities): “MACD line remains below zero, DI- comfortably above DI+, both highlighting strong bearish bias. 20-day EMA zone of ₹46.5-47 likely acts as stiff resistance. As long as stock trades below this zone, overall trend expected to remain bearish.”
Translation: The stock could trade down to ₹40-42 levels before finding genuine support where buyers overwhelm sellers.
Next support levels:
- ₹44: Current zone (already broken)
- ₹42: Psychological support
- ₹40: Major support (20% below current)
- ₹36: Extreme downside (where some bulls see value)
Risk #2: Execution Risk on Large Order Book
6.4 GW order book sounds impressive, but execution challenges loom:
- Supply chain delays: Global turbine component shortages
- Grid connectivity: Transmission infrastructure bottlenecks delay commissioning
- Client payment delays: Working capital stress if customers slow payments
- Monsoon disruptions: H1 FY27 execution could face weather delays
If Suzlon misses quarterly targets or guides lower, the stock could break ₹40 support decisively.
Risk #3: Margin Compression Risk
Q3 EBITDA margin at 17.3% is healthy, but faces pressure from:
- Steel prices rising: Input cost inflation
- Copper prices elevated: Electrical components expensive
- Rare earth shortages: Permanent magnets supply constrained
- Wage inflation: Skilled technician shortage in wind sector
If margins compress to 14-15% (from 17.3%), profit could fall 15-20% even with revenue growth — and the stock could retest ₹35-40.
Risk #4: Valuation Still Not Cheap
At ₹44, Suzlon trades at:
- 29-37x P/E: Still expensive
- 9x+ P/B: Premium for asset-heavy business
For perspective, in a severe bear market scenario, cyclical industrials trade at:
- 12-18x P/E: Fair value
- 2-4x P/B: Distress pricing
If market reprices Suzlon to 18x P/E, fair value could be ₹28-32 — implying another 30-35% downside from ₹44.
What Should Investors Do Now? The Four Strategies
Strategy #1: SELL and Accept Losses (Risk Averse Investors)
Who Should Sell:
- Bought at ₹60-74 range (currently -27% to -40% underwater)
- Cannot tolerate another 20-30% potential downside
- Need capital for other opportunities
- Don’t believe in renewable energy sector recovery
Why Sell Now:
- Technical indicators suggest further downside to ₹40-42
- Tax loss harvesting — book losses to offset other gains
- Opportunity cost — capital could be deployed in recovering sectors (PSU banks, metal stocks)
- Psychological relief — cut losers, move on
How to Execute:
- Exit in tranches: Sell 50% now, remaining 50% if bounces to ₹47-48
- Use proceeds to diversify into less volatile large-caps
- Write off Suzlon as learning experience about sector timing
Strategy #2: HOLD and Wait (Medium-Term Investors)
Who Should Hold:
- Entry price below ₹50 (still near breakeven or small loss)
- Believe in long-term India renewable story
- Can tolerate 2-3 year holding period
- Don’t need the capital immediately
Why Hold:
- Order book 6.4 GW provides business visibility
- Zero debt means bankruptcy risk minimal
- Analysts median target ₹64.50 (+45% upside) within 12 months
- Worst might be over — already down 40% from peak
Risk Management While Holding:
- Set mental stop-loss at ₹40 — exit if breaks decisively
- Don’t average down yet — wait for technical confirmation of bottom
- Limit Suzlon to 3-5% of portfolio maximum
Strategy #3: BUY Aggressively (Contrarian Value Investors)
Who Should Buy:
- Zero current Suzlon exposure
- Long-term horizon (3-5+ years)
- High risk tolerance
- Believe 40% correction has created value
Why Buy Now:
- Forward P/E of 20-22x based on FY27 estimates is reasonable
- 6.4 GW order book + 28% ROCE = strong fundamentals
- Zero debt provides downside protection
- Mean reversion: Stock delivered 816% over 5 years, current dip likely temporary
How to Execute:
- Tranche buying: Invest 30% at ₹44-46, 30% at ₹42, 40% at ₹40
- Position sizing: Limit to 5-8% of portfolio given volatility
- Target: ₹64-70 (12-18 months) = 45-55% gain potential
- Stop-loss: ₹38 (12% downside from ₹44 entry)
Risk-Reward: Risk ₹6 per share to make ₹20-26 per share = 3-4:1 ratio (acceptable)
Strategy #4: TACTICAL TRADING (Active Traders)
Who Should Trade:
- Experienced traders comfortable with volatility
- Can monitor stock daily
- Understand technical analysis
- Have capital for active deployment
Trading Setup:
- Buy zone: ₹43-44 when RSI reaches 25-30 (oversold)
- Sell zone: ₹47-48 (20-day EMA resistance)
- Target profit: 8-10% per round trip
- Stop-loss: Tight 3-4% below entry
- Frequency: 2-3 trades over next 3-6 months
Example Trade:
- Buy: ₹43.50 (when oversold)
- Target: ₹47.50 (9.2% gain)
- Stop: ₹42 (3.4% loss)
- Risk-reward: 1:2.7 (excellent)
Analyst Views & Price Targets: The Mixed Verdict
| Source | Rating | Target (₹) | Timeframe | Current Implication | |—|—|—|—| | Median Consensus | — | ₹64.50 | 12 months | +45% upside | | Range | — | ₹52-78 | 12 months | +17% to +76% | | MarketsMojo | Sell | — | — | Downgraded from Hold | | Mojo Score | 36.0 | — | — | Weak fundamentals | | SBI Securities | — | — | — | Bearish bias below ₹47 | | Mirae Asset | — | ₹48-54 | Near-term | Triangle pattern forming |
What the Divergence Means:
Wide analyst target range (₹52-78) reflects genuine uncertainty:
- Bulls see: ₹78 based on 6.4 GW order book execution + margin expansion
- Bears see: ₹52 based on execution risk + sector headwinds
- Reality: Likely ₹60-65 if company delivers on guidance
Key Takeaways: Suzlon at 52-Week Low — The Verdict
→ Suzlon crashed 41% from ₹74.30 May 2025 peak to ₹43.85-44.26 52-week low in February 2026 despite strong Q3 results (profit +15% to ₹445 Cr, revenue +42% to ₹4,228 Cr) — representing disconnect between business performance and stock price.
→ Five catalysts drove collapse: (1) ₹9.6 Cr Chennai customs penalty creating governance concerns, (2) complete technical breakdown below all moving averages signaling downtrend, (3) sector-wide renewable energy correction, (4) profit-taking after 816% five-year rally, (5) valuation concerns at 29-37x P/E despite strong results.
→ Bullish case rests on three pillars: (1) Record 6.4 GW order book providing 15-18 months revenue visibility, (2) Zero debt balance sheet eliminating bankruptcy risk, (3) Operating leverage driving 55.82% profit growth vs 39.30% revenue growth showing margin expansion potential.
→ Bearish case warns of further downside: (1) Technical indicators suggest ₹40-42 next support levels, (2) Execution risk on large order book with supply chain/grid delays, (3) Margin compression risk from steel/copper inflation, (4) Valuation at 29x P/E still expensive for cyclical industrial.
→ Four strategies based on investor profile: (1) SELL if bought above ₹60 and cannot tolerate another 20-30% drop, (2) HOLD if entry below ₹50 and can wait 2-3 years for recovery to ₹64-70, (3) BUY in tranches (30% at ₹44, 30% at ₹42, 40% at ₹40) if long-term contrarian, (4) TRADE ₹43-44 buy to ₹47-48 sell for 8-10% gains.
→ Analyst consensus target ₹64.50 (+45% upside) but wide range ₹52-78 reflects genuine uncertainty — stock likely reaches ₹60-65 if executes 6.4 GW order book without delays over next 12-18 months.
→ Key levels to watch: ₹47 resistance (20-day EMA), ₹44 current support, ₹42 major support, ₹40 critical support — break below ₹40 opens ₹36-38 downside, hold above ₹44 and break ₹47 targets ₹52-54 recovery.
This article is for educational purposes only and does not constitute investment advice. All investment decisions should be made based on individual risk tolerance, financial goals, and in consultation with a SEBI-registered investment advisor.
Data sourced from publicly available information as of February 19-24, 2026. Sources include: Business Today, INDmoney, Tickertape, Samco, MarketsMojo, Bajaj Broking, Upstox, NSE/BSE data, company filings, analyst report