SBI Share Price Near All-Time High ₹1,225: Buy or Sell Feb 2026?
SBI Share Price Near All-Time High ₹1,225 on Feb 24, 2026: Record ₹21,028 Cr Profit Drives PSU Bank Rally — Buy, Hold or Sell?
By Senior Indian Banking Sector and Equity Markets Analyst · February 24, 2026 · 9 Min Read
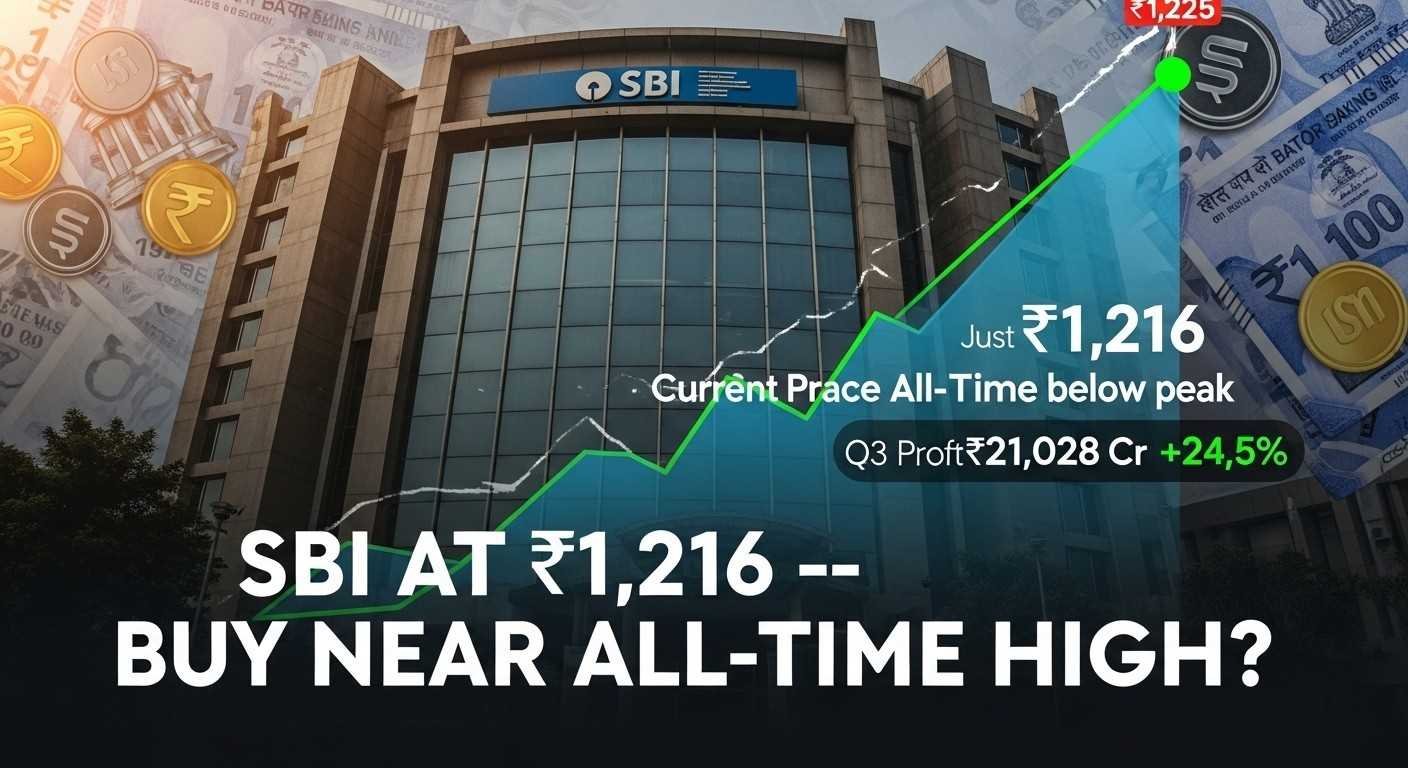
State Bank of India trades at ₹1,216 on Monday, February 24, 2026 — just ₹9 (0.7%) below its all-time high of ₹1,225.50 reached in January, capping a remarkable 79% rally from the ₹680 52-week low. The surge follows record-breaking Q3 FY26 results where standalone net profit jumped 24.5% YoY to ₹21,028 crore — India’s largest quarterly profit by any bank ever — driven by robust 15% credit growth, improving asset quality (GNPA at 1.57%), and strong fee income. Yet with 31 analysts giving overwhelming “Buy” consensus and average target at ₹1,200 implying minimal upside, the critical question facing investors: is SBI a buy at these elevated levels near all-time peaks, or should you wait for correction after the 79% vertical move?
SBI Share Price Today: Standing at the Summit (February 24, 2026)
State Bank of India’s position at ₹1,216 — within striking distance of its ₹1,225.50 all-time high — reflects a market rewarding India’s largest lender for flawless execution across profitability, asset quality, and capital strength despite challenging macro headwinds.
| Metric | Current Data (Feb 20-24, 2026) |
|---|---|
| Current Share Price | ₹1,206.10 – ₹1,216.10 |
| Previous Close (Feb 20) | ₹1,205.70 |
| Day’s Range (Feb 20) | ₹1,201.80 – ₹1,217.40 |
| 52-Week High | ₹1,225.50 (Jan 2026) |
| 52-Week Low | ₹680.00 |
| From All-Time High | -₹9 to -₹19 (-0.7% to -1.6%) |
| From 52-Week Low | +₹536 (+78.8%) |
| Market Capitalisation | ₹10,55,796 – ₹10,82,835 Cr |
| P/E Ratio (TTM) | 13.02 to 14.10 |
| Price-to-Book Ratio | 2.17 to 2.29 |
| EPS (Q3 FY26) | ₹22.78 (quarterly) |
| EPS (FY25 Annual) | ₹86.91 |
| Book Value Per Share | ₹558 (approx) |
| Dividend Yield | Moderate |
| 1-Year Return | +67.35% to +79% |
| 6-Month Return | +44% |
| Trading Volume (Daily) | 31-84 lakh shares |
Note: Data from Investing.com, Yahoo Finance, Dhan, Business Standard, Groww as of February 20-24, 2026.
The stock’s proximity to ₹1,225.50 all-time high achieved in January is not accidental — it reflects institutional validation of SBI’s transformation from cyclical PSU bank to consistent profit compounder. The 79% one-year rally from ₹680 to ₹1,216 has added approximately ₹4.5 lakh crore to market capitalization, making SBI India’s most valuable public sector bank with ₹10.8+ lakh crore valuation.
However, technical traders note the stock has been consolidating in the ₹1,200-1,225 range for nearly six weeks, suggesting profit-taking at these elevated levels despite strong fundamentals. The daily trading volume of 31-84 lakh shares shows sustained institutional interest but also highlights that momentum may be slowing after the vertical 50-day moving average break.
Q3 FY26 Results: The Record-Breaking Performance That Justified the Rally
SBI’s Q3 FY26 results released February 7, 2026 delivered India’s highest-ever quarterly bank profit — shattering analyst estimates across every major parameter and providing fundamental justification for the stock trading near all-time highs.
| Financial Metric | Q3 FY26 | Q3 FY25 | YoY Change | Q2 FY26 | QoQ Change |
|---|---|---|---|---|---|
| Standalone Net Profit | ₹21,028 Cr | ₹16,891 Cr | +24.49% | ~₹18,000 Cr | +16.8% (est.) |
| Consolidated Net Profit | ₹21,317 Cr | ₹18,853 Cr | +13.06% | ₹21,137 Cr | +0.85% |
| Net Interest Income (NII) | ₹45,190 Cr | ₹41,446 Cr | +9.04% | — | — |
| Operating Profit | ₹32,862 Cr | ₹23,544 Cr | +39.54% | — | — |
| Total Income | ₹1,40,915 Cr | ₹1,28,467 Cr | +9.69% | — | — |
| Non-Interest Income | ₹18,359 Cr | ₹11,029 Cr | +66.47% | — | — |
| Domestic Net Interest Margin | 3.12% | 3.15% | -3 bps | 3.09% | +3 bps |
| Gross NPA Ratio | 1.57% | 2.07% | -50 bps | 1.73% | -16 bps |
| Net NPA Ratio | 0.39% | 0.53% | -14 bps | 0.42% | -3 bps |
| Provision Coverage Ratio | 75.54% | — | — | — | — |
| Capital Adequacy Ratio (CRAR) | 14.04% – 14.05% | — | Strong | — | — |
| Return on Assets (RoA) | 1.19% (annualized) | — | Improved | — | — |
| Gross Advances Growth | 15.14% YoY | — | ₹46.84 lakh Cr | — | — |
| Deposit Growth | 9.02% YoY | — | ₹57.01 lakh Cr | — | — |
| CASA Ratio | 39.13% | — | — | — | — |
Note: Data from SBI Q3 FY26 results, Business Standard, BusinessToday, PSU Connect.
The Exceptional:
- All-Time High Quarterly Profit: ₹21,028 crore standalone profit is the highest quarterly profit by any Indian bank in history, surpassing HDFC Bank and ICICI Bank
- Non-Interest Income Surge: 66% jump driven by ₹2,200 crore one-time SBI Mutual Fund dividend, ₹3,280 crore treasury gains, and strong fee income
- Asset Quality at Decade Best: GNPA at 1.57% and NNPA at 0.39% are SBI’s cleanest books in over 10 years, validating risk management improvements
- Broad-Based Credit Growth: Retail +15%, SME +21%, Agriculture +16%, Corporate +13.37% — no concentration risk
The Concerns:
- NIM Compression: Domestic NIM fell 3 bps YoY to 3.12% despite repricing benefits, signaling pricing power limitations in competitive environment
- Deposit Growth Lagging Credit: 9% deposit growth versus 15% credit growth widens credit-deposit ratio to 73%, creating funding pressure
- One-Time Income Boosts: ₹2,200 Cr MF dividend and ₹3,280 Cr treasury gains are non-recurring — underlying core profitability growth closer to 15-17%
- Provision Increase: Provisions rose 77.7% YoY to ₹11,834 crore, though this reflects conservative prudence rather than stress

Analyst Consensus: Unanimous Buy with ₹1,200 Target (Already There!)
The institutional analyst community covering SBI shows rare near-unanimity with 31 “Buy” ratings and zero “Hold” recommendations — yet the average target price of ₹1,200 has essentially been achieved, creating a peculiar valuation paradox.
| Analyst Consensus | Count | Percentage |
|---|---|---|
| Strong Buy / Buy / Outperform | 31 | 100% |
| Hold / Neutral | 0 | 0% |
| Sell / Underperform | 0 | 0% |
| Total Analysts Covering | 31 | 100% |
| Price Target Data | Value (₹) | Implied Upside/Downside |
|---|---|---|
| Average 12-Month Target | ₹1,200 – ₹1,225 | -1.3% to +0.7% |
| Highest Target | ₹1,310 | +7.7% |
| Lowest Target | ₹1,025 | -15.7% |
| Median Target | ₹1,225 | +0.7% |
| Current Price | ₹1,216 | — |
Specific Brokerage Targets:
| Institution | Rating | Price Target (₹) | Key Thesis | |—|—|—| | Motilal Oswal | Buy | ₹1,300 | Improved 13-15% credit growth guidance | | JM Financial | Buy | ₹1,250 | Valuing at 1.5x FY27 adjusted book | | Emkay Global | Buy | ₹1,225 | Strong core operations despite NIM pressure | | CLSA | Outperform | ₹1,170 | Maintained despite Q3 earnings beat | | Motilal Oswal | Buy | ₹925 | Some brokerages still below ₹1,000 | | ICICI Securities | Buy | ~₹1,200 (est.) | Consensus aligned |
Note: Targets from Business Standard, Investing.com, AnalyticsInsight, various brokerage research.
The Paradox:
The 100% Buy consensus with zero Hold ratings is statistically unprecedented for a large-cap stock trading at all-time highs. Typically, when stocks approach analyst targets, 40-60% of analysts downgrade to Hold to maintain credibility. The absence suggests either:
- Genuine conviction that SBI’s earnings trajectory justifies higher multiples
- Herd mentality where no analyst wants career risk of being lone contrarian on India’s most important PSU bank
- Target chasing where analysts reluctantly raised targets to ₹1,200-1,300 after stock already reached ₹1,150-1,200
The fact that average target of ₹1,200 implies -1.3% downside from current ₹1,216 is telling — the “Buy” ratings are institutional courtesy, not actionable recommendations for new money.
The Bull Case: Why SBI Could Reach ₹1,400-1,500 by FY27
The optimistic scenario argues that SBI at ₹1,216 remains undervalued despite trading near all-time highs — if you believe India’s largest bank deserves premium valuations reflecting its transformation from cyclical lender to consistent compounder.
1. Valuation Still Reasonable at 2.17x Book and 14x Earnings
SBI trades at 2.17-2.29x price-to-book and 13-14x P/E — substantial discount to private peers HDFC Bank (3.5x book, 19x P/E) and ICICI Bank (3.0x book, 17x P/E). If SBI closes the valuation gap to 2.5-2.8x book (still below private banks), stock reaches ₹1,395-1,565 based on ₹558 book value.
2. Credit Growth Guidance Raised to 13-15% for FY26
Management increased credit growth guidance from 12-14% to 13-15% following strong Q3 momentum. If sustained through FY27, this 14%+ loan CAGR combined with stable NIMs delivers 18-20% earnings growth — justifying 16-18x forward P/E, implying ₹1,400-1,500 fair value.
3. Asset Quality at Best-Ever Levels Creates Provisioning Tailwind
GNPA at 1.57% and NNPA at 0.39% are decade lows. As credit costs normalize to 0.30-0.35% (from current elevated prudence), provisioning release adds 100-150 basis points to RoA. That operating leverage flows directly to EPS, enabling 20%+ earnings growth without revenue acceleration.
4. Foreign Institutional Buying Accelerating in PSU Banks
FIIs increased stakes in SBI, Bank of Baroda, Canara Bank, PNB in January-February 2026 — bucking broader equity pullback. As global investors rotate from expensive private banks (HDFC Bank PE 19x) to value PSU banks (SBI PE 14x), sustained FII buying creates technical tailwind.
5. RBI Easing Cycle Benefits SBI’s Treasury and Corporate Book
The expected 50-75 basis points of RBI rate cuts through 2026 benefits SBI’s ₹6+ lakh crore government securities portfolio through mark-to-market gains and lowers corporate borrowers’ funding costs, stimulating credit demand in wholesale book.
The Bear Case: Why SBI at ₹1,216 is Fully Valued and Vulnerable
The pessimistic scenario argues that SBI’s 79% rally has priced in 2-3 years of perfect execution, and any disappointment triggers 15-25% correction back toward ₹950-1,000 levels where valuation support emerges.
1. Already Trading at Average Analyst Target — Upside Exhausted
With current price ₹1,216 versus average target ₹1,200-1,225, the risk-reward is asymmetric. Consensus sees 0-1% upside but 15-20% downside to ₹1,025 bear case. Even bulls struggle to justify targets above ₹1,300 without assuming aggressive multiple expansion that PSU banks rarely sustain.
2. NIM Compression Accelerates as Rate Cut Cycle Begins
Domestic NIM already compressed 3 bps YoY despite repricing benefits. As RBI cuts rates and competitive deposit pricing intensifies, NIMs face structural pressure toward 2.80-2.90% (from 3.12%), compressing profitability. Management acknowledged limited MCLR repricing headroom (35 bps) that evaporates when cuts begin.
3. Deposit Growth Crisis Threatens Liability Franchise
9% deposit growth versus 15% credit growth is unsustainable — credit-deposit ratio at 73% strains funding model. Chairman Setty admitted “structural challenge for deposit mobilisation” as household savings shift to mutual funds and equities. If deposit growth doesn’t accelerate to 12-13%, credit growth must slow — killing bull thesis.
4. One-Time Income Masks Core Earnings Weakness
Strip out ₹2,200 Cr SBI MF dividend and ₹3,280 Cr treasury gains, and Q3 core operating profit grows only 12-15% — pedestrian for a stock at all-time highs. Investors paying 14x P/E are buying non-recurring windfall gains, not sustainable earnings power.
5. Technical Resistance at ₹1,225 Proven Impenetrable
Stock failed to break and hold above ₹1,225 three times in January-February 2026, forming triple-top technical pattern. The ₹1,200-1,225 zone has become distribution area where institutions sell to retail. Breaking above requires external catalyst (sector M&A, policy reform) that isn’t visible currently.
→ SBI at ₹1,216 trades just ₹9 (0.7%) below all-time high of ₹1,225.50 after 79% rally from ₹680 52-week low — driven by record Q3 FY26 profit ₹21,028 Cr (+24.5% YoY), India’s highest-ever quarterly bank profit.
→ Asset quality at decade-best levels — GNPA 1.57% and NNPA 0.39% represent SBI’s cleanest books in 10+ years, validating risk management transformation and creating provisioning tailwind for future earnings.
→ Analyst consensus shows 31/31 Buy ratings (100%) with zero Hold — but average target ₹1,200-1,225 implies current price has already reached upside, creating paradox where “Buy” ratings carry no meaningful upside potential.
→ Valuation at 2.17x book and 14x P/E appears reasonable versus private banks (HDFC Bank 3.5x book) — suggesting 15-25% upside to ₹1,400-1,500 IF SBI closes valuation gap, but this assumes sustained 18-20% earnings CAGR.
→ Credit growth guidance raised to 13-15% for FY26 is bullish — but deposit growth lagging at 9% YoY creates structural funding pressure with credit-deposit ratio at 73%, threatening earnings growth sustainability.
→ Key risks include NIM compression (already -3 bps YoY despite repricing), deposit mobilization challenges as households shift to equities/MFs, one-time income (₹2,200 Cr MF dividend + ₹3,280 Cr treasury gains) masking 12-15% core profit growth.
→ Technical resistance at ₹1,225 proven impenetrable — three failed breakout attempts in January-February 2026 form triple-top pattern suggesting distribution, requiring external catalyst to move meaningfully higher.
FAQ: SBI Share Price Near All-Time High February 2026
Q1. Should I buy SBI stock at ₹1,216 near all-time high of ₹1,225?
Buy SBI at ₹1,216 only if: (1) you have 3-5 year investment horizon allowing time for valuation gap to private banks to close, (2) you believe PSU banks deserve re-rating to 2.5-2.8x book from current 2.17x, (3) you can tolerate 15-20% correction to ₹1,000-1,025 if deposit growth concerns escalate. Do NOT buy if: (1) chasing momentum after 79% rally, (2) expecting immediate returns as average analyst target ₹1,200-1,225 already achieved, (3) need stable dividends as yield is moderate. Conservative investors should wait for pullback to ₹1,100-1,150 for better risk-reward.
Q2. What is SBI’s target price for 2026-2027?
Analyst consensus target ranges from ₹1,025 (bear case) to ₹1,310 (bull case) with average at ₹1,200-1,225 — essentially current price. Motilal Oswal’s ₹1,300 and JM Financial’s ₹1,250 represent optimistic scenarios assuming sustained 13-15% credit growth, NIM stabilization at 3.00-3.10%, and multiple expansion to 1.5x FY27 book. Conservative targets near ₹1,025 reflect concerns about deposit growth lagging, NIM compression, and one-time income inflating Q3 results. For ₹1,400-1,500 upside, SBI must close valuation gap to 2.5x book — requiring flawless execution.
Q3. Is SBI overvalued or undervalued at current ₹1,216 price?
SBI at 2.17x book and 14x P/E is neither cheap nor expensive — fairly valued for current fundamentals. The stock trades at 30-40% discount to HDFC Bank (3.5x book, 19x P/E) and ICICI Bank (3.0x book, 17x P/E), suggesting relative value IF you believe the quality gap has narrowed. However, PSU banks historically trade at 1.5-2.0x book during normal periods — current 2.17x reflects premium valuation only justified if credit growth sustains 14%+ and asset quality remains pristine. At ₹1,216, you’re paying for quality that must be delivered, not margin of safety.
Q4. Why did SBI share price rally 79% in one year?
Five catalysts drove the 79% rally from ₹680 to ₹1,216: (1) consistent profitability improvement with Q3 hitting all-time high ₹21,028 Cr profit, (2) asset quality transformation to GNPA 1.57% and NNPA 0.39% from stressed levels 3-4 years ago, (3) successful ₹25,000 Cr FPO in July 2025 strengthening capital base to 14% CRAR, (4) foreign institutional buying accelerating in PSU banks as valuations appear attractive versus private peers, (5) broader PSU bank sector re-rating as government ownership no longer seen as liability but advantage in infrastructure/project lending.
Q5. What are the main risks of investing in SBI at all-time high?
Six critical risks: (1) deposit growth at 9% versus credit at 15% is unsustainable — credit growth must slow or funding costs spike destroying NIMs, (2) NIM compression already -3 bps YoY will accelerate as RBI cuts rates and competition intensifies, (3) one-time income (₹5,480 Cr from MF dividend + treasury gains) inflated Q3 results — core earnings growth only 12-15%, (4) technical resistance at ₹1,225 after three failed breakout attempts suggests distribution not accumulation, (5) average analyst target already achieved leaving minimal upside for new buyers, (6) broader market correction or PSU bank scandal could trigger 20-25% selloff to ₹950-1,000.
Q6. How does SBI compare to HDFC Bank and ICICI Bank as investment?
SBI advantages: (1) valuation discount (2.17x book vs HDFC 3.5x, ICICI 3.0x), (2) strongest retail deposit franchise in India with unmatched reach, (3) government backing reduces tail risk, (4) higher operating leverage as asset quality normalizes. HDFC/ICICI advantages: (1) consistently higher ROAs (1.8-2.2% vs SBI 1.19%), (2) superior NIMs (3.5-3.8% vs SBI 3.12%), (3) no political interference or PSU governance constraints, (4) better technology/digital infrastructure. Verdict: SBI offers relative value for contrarian investors willing to hold 3-5 years, but HDFC/ICICI provide higher quality compounding for conservative long-term wealth builders.
This article is for educational purposes only and does not constitute investment advice. All investment decisions should be made based on individual financial goals, risk tolerance, and in consultation with a SEBI-registered investment advisor.
Data sourced from publicly available information as of February 20-24, 2026. Sources include: NSE India, BSE India, Investing.com, Yahoo Finance, Dhan, Business Standard, BusinessToday, PSU Connect, AnalyticsInsight, Groww, SBI investor relations, Q3 FY26 results presentations, various brokerage research reports.