The 2026 EV & Sustainable Energy Transition: Global Progress, India’s Struggle & The Reality Behind the Headlines
By Senior Energy Markets and Sustainability Analyst · February 18, 2026 · 8 Min Read
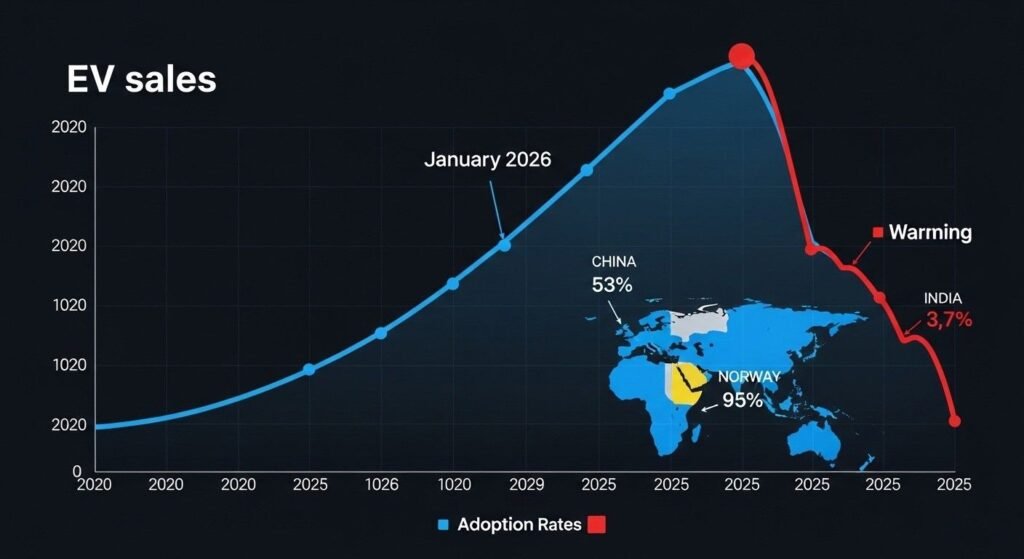
Global EV sales just slipped 3% in January 2026 — the first decline in years — while renewable energy installations hit a record 800 GW in 2025. That contradiction defines the 2026 energy transition: solar and wind are unstoppable economic forces, but electric vehicles face policy headwinds, subsidy rollbacks, and consumer hesitation that threaten adoption targets from Beijing to Berlin. India ranks 47th out of 51 countries in EV adoption at just 3.7% penetration, yet holds 97 GW of installed solar capacity and aims for 500 GW non-fossil capacity by 2030. So is the 2026 sustainable energy transition accelerating toward climate goals — or fragmenting into disconnected national priorities that miss the COP28 target to triple renewable capacity?
The 2026 EV Market Reality: Global Sales Slip Despite Long-Term Growth Trajectory
Electric vehicle adoption in 2026 presents a paradox that institutional investors and policymakers are struggling to reconcile — long-term structural growth remains intact, but near-term momentum has stalled amid policy shifts, subsidy reductions, and economic uncertainty that is forcing a recalibration of ambitious targets.
| Global EV Market Metric | January 2026 Data |
|---|---|
| Global EV Registrations (Jan 2026) | ~1.2 million units |
| YoY Change (Jan 2026 vs Jan 2025) | -3% |
| Vehicle Types Included | BEV + PHEV |
| China Monthly Sales Trend | Weakest in ~24 months |
| US Market Performance | Sharp pullback, incentives reduced |
| Europe Growth Rate | Positive but slowest in ~1 year |
| Hybrid Vehicle Trend | Gaining ground vs pure EVs |
| Automaker Writedowns (Past Year) | ~$55 billion globally |
| China EV Market Share 2025 | 53% of new car sales |
| Norway EV Market Share 2025 | 95% of new car sales |
| India EV Market Share 2025 | 3.7% (passenger vehicles only) |
| India Global Ranking (EV Adoption) | 47th out of 51 countries |
Note: Data compiled from Benchmark Mineral Intelligence via Reuters, Autocar India, Business Standard, various industry sources as of February 2026.
The 3% global decline in January 2026 EV registrations marks the first year-over-year contraction in years and signals that the effortless exponential growth phase has ended. China, which accounts for over half of global EV sales, recorded its weakest monthly performance in nearly two years — driven by subsidy phase-outs and economic headwinds that have made price-sensitive consumers hesitate.
The US market pullback is even more dramatic. Automakers have booked approximately $55 billion in writedowns over the past year as they reassess EV strategies in response to “sluggish demand and competitive pressures,” according to Benchmark Mineral Intelligence. The rollback of federal tax credits and state-level incentives under the current administration has created sticker shock that dealers are struggling to overcome despite aggressive manufacturer discounting.
Europe’s growth continues — but at its slowest pace in about a year, reflecting saturation in early-adopter markets like Norway (95% EV share) while mass-market countries like Germany and France face affordability barriers and charging infrastructure gaps that prevent mainstream adoption.
India’s EV Adoption Crisis: Ranking 47th Out of 51 Countries Despite Government Targets
India’s electric vehicle performance in 2026 is a sobering case study in the gap between policy ambition and market reality. Despite a government target of 30% EV share by 2030, the Ministry of Heavy Industries now estimates adoption will reach only 10% — a tacit admission that the original target was “overly ambitious.”
| India EV Market Data | 2025 Actuals / 2026 Status |
|---|---|
| Passenger EV Sales 2025 | 176,000 units |
| Total New Car Sales 2025 | 4.5 million units |
| EV Market Share (Passenger) | 3.7% – 4.0% |
| Global Ranking (EV Adoption) | 47th out of 51 countries |
| Countries Below India | South Africa, Chile |
| Government Target 2030 | 30% EV share |
| Revised Realistic Estimate | ~10% by 2030 |
| EV Two-Wheeler Sales Jan 2026 | Strong positive growth (Bajaj, TVS) |
| Ola Electric Trend | Continued decline |
| Charging Stations (Karnataka) | 6,097 (highest in India, July 2025) |
| EV Penetration Leader (State) | Kerala at 7.9% |
| Passenger EV Growth Q1 FY26 | +75% YoY (raising share to 3.5% from 2%) |
Note: Data from Business Standard, BikeAdvice, IBEF, DriveSpark, various government sources.
The 3.7% penetration rate places India near the bottom globally — just above South Africa and Chile. In stark contrast, neighbor Nepal achieved 73% EV share in 2025 (up from 56% in 2019) through aggressive incentives and rapid charging buildout, demonstrating that geographical proximity and development level do not predetermine EV success.
The disparity highlights India’s core challenge: high upfront EV costs relative to income levels. A Tata Nexon EV starts at approximately ₹14.5 lakh while the petrol version begins at ₹8 lakh — a ₹6.5 lakh premium that middle-class buyers cannot justify despite lower running costs. Battery-as-a-service models introduced by JSW MG Motor and now Maruti Suzuki for the eVitara aim to address this by decoupling battery cost from vehicle purchase, but adoption remains nascent.
However, India’s two-wheeler EV segment tells a different story. January 2026 sales showed strong growth for TVS and Bajaj, while Ola Electric’s slide continues. The lower absolute price point of electric scooters (₹80,000-1,50,000) makes the EV premium more digestible for urban commuters, explaining why two-wheeler electrification is outpacing cars.
The 2026 Renewable Energy Boom: 800 GW Installations But Still Short of COP28 Tripling Goal
While EV adoption stumbles, renewable energy deployment surged to record levels in 2025 — demonstrating that the energy transition’s success is sector-specific rather than monolithic. Solar and wind economics have become too compelling to ignore, insulating deployment from political volatility in ways that EV subsidies cannot.
| Renewable Energy Metric 2025-2026 | Data |
|---|---|
| Global Solar + Wind Installations 2025 | ~800 GW (record) |
| Tripling Since | 2021 (3x growth in 4 years) |
| Projected Installations 2026 | Flat to modest growth |
| New Wind + Solar 2026-2030 | 4.5 TW (4,500 GW) |
| Increase vs Prior 5 Years | +67% |
| Solar Share of Global Increase | ~80% |
| Wind Share | ~30% (includes offshore) |
| China Solar Installations 2026 | 390 GW (56% of global) |
| China Wind Installations 2026 | 86 GW (60% share) |
| India Solar Capacity (Installed) | ~97 GW |
| India Wind Capacity | ~48 GW |
| India Non-Fossil Target 2030 | 500 GW |
| Spain Wholesale Electricity Price Drop | -32% vs EU avg (H1 2025) |
| Renewables Share of Global Electricity | 32% (2024) → 43% projected (2030) |
| Coal as Largest Source Displaced | By end 2025 or mid-2026 |
Note: Data from IEA Renewables 2025 Report, Global Energy Monitor, BloombergNEF, Deloitte, various sources.
The 800 GW of global solar and wind installations in 2025 represents a tripling of annual deployment since 2021 — a growth rate that no other energy infrastructure sector has matched in modern history. However, even this record pace falls short of what is needed to meet the COP28 commitment to triple renewable capacity by 2030.
The International Renewable Energy Agency estimates that achieving the tripling goal requires an average of 317 GW of wind and 735 GW of solar annually through 2030. Even if every planned wind and utility-scale solar project with a 2030 start year came online on schedule, the world would still fall short by 1 TW of wind and 1.6 TW of utility-scale solar. Moreover, Global Energy Monitor analysis shows that almost 40% of planned projects are either late or get shelved/cancelled — making the gap even wider.
China’s dominance is overwhelming. The country is expected to install 390 GW of solar (56% of global capacity) and 86 GW of wind (60% share) in 2026 alone — more than the combined total of the next six countries including Brazil, Australia, India, the US, Spain, and the Philippines. That concentration creates supply chain vulnerabilities and geopolitical dependencies that Western policymakers are scrambling to address through domestic manufacturing incentives.
The Reality Behind Headlines: Why The Energy Transition Is Fragmenting Not Accelerating
The 2026 energy transition’s defining characteristic is fragmentation — different countries are running different races toward incompatible goals, making global coordination increasingly difficult and raising serious questions about whether collective climate targets remain achievable.
Three Competing National Priorities Are Creating Divergent Paths:
1. United States: AI Dominance Over Climate Leadership The US has subjugated clean energy leadership to the race for artificial intelligence dominance. Policy reversals have reduced projected renewable capacity by 30% according to Wood Mackenzie, and emissions reductions have been delayed by approximately five years per DNV estimates. The “One Big Beautiful Bill Act” rolled back clean energy tax credits, shortened qualification windows, and imposed Foreign Entity of Concern restrictions that raised supply chain costs.
However — and this is critical — renewables still dominated US capacity additions through September 2025, accounting for 93% of new installations (30.2 GW), with solar and storage comprising 83%. That disconnect between hostile policy and continued deployment reflects the economic reality that renewable power is simply cheaper than fossil alternatives in most locations, creating a floor under deployment that rhetoric cannot break.
2. China: Manufacturing Scale + Energy Security + EV Export Strategy China’s success in EVs means domestic oil demand has already peaked, limiting exposure to fuel imports. The country’s renewable sector suggests coal (and therefore emissions) may also be peaking. However, China’s priorities are industrial competitiveness and technological leadership — not climate altruism. The 390 GW solar and 86 GW wind deployment in 2026 is driven by manufacturing overcapacity that must be absorbed domestically before being exported.
Chinese EV manufacturers are flooding Southeast Asia with exports as domestic demand softens, creating trade tensions that will shape the next phase of global EV adoption. The government’s strategy is explicitly “self-sufficiency over global trade and sustainability,” per DNV — a framing that delivers emissions reductions as a side effect rather than a primary goal.
3. Europe: Energy Security Through Renewables The European Union views renewable deployment through the lens of energy independence following the Russia-Ukraine gas supply shock. Spain has proven the economic case — wholesale electricity prices 32% lower than EU average in H1 2025, largely because solar and wind displaced expensive gas and coal generation.
The Net-Zero Industry Act aims to ensure 40% of EU’s annual deployment needs for key technologies are manufactured domestically by 2030. However, momentum is uneven. States like Ohio are sunsetting renewable portfolio standards after 2026, and North Carolina rolled back carbon reduction targets, both citing affordability concerns.
Key Takeaways
→ Global EV sales slipped 3% in January 2026 to 1.2M units — first YoY decline in years — driven by China’s weakest performance in 24 months, US subsidy rollbacks causing $55B in automaker writedowns, and Europe’s slowest growth pace in a year.
→ India ranks 47th out of 51 countries in EV adoption at just 3.7% penetration despite 30% government target for 2030 — Ministry now estimates realistic adoption at only 10%, placing India just above South Africa and Chile while neighbor Nepal achieved 73%.
→ Renewable energy surged to record 800 GW solar/wind installations in 2025 (3x since 2021) — but still falls short of COP28 tripling goal requiring 317 GW wind + 735 GW solar annually through 2030, with shortfall of 1 TW wind and 1.6 TW solar even if all planned projects deliver.
→ China installed 390 GW solar (56% of global) and 86 GW wind (60% share) in 2026 — more than next six countries combined — creating supply chain concentration above 90% through 2030 and geopolitical dependencies that Western manufacturing incentives cannot break quickly.
→ The energy transition is fragmenting not accelerating — US prioritizes AI over climate delaying emissions cuts 5 years, China pursues manufacturing dominance with climate as side effect, Europe seeks energy security through renewables, undermining collective climate coordination.
→ Economic fundamentals support renewables over policy — Spain’s wholesale electricity 32% cheaper than EU average from solar/wind displacement of gas, and renewables accounted for 93% of US capacity additions despite hostile policy, demonstrating cost advantages create deployment floor that politics cannot break.
FAQ: 2026 EV & Sustainable Energy Transition
Q1. Are EV sales declining globally in 2026? Yes, global EV sales slipped 3% YoY in January 2026 to approximately 1.2 million units — the first decline in years — driven by weakening demand in China (weakest monthly performance in 24 months), sharp US pullback as federal incentives eased, and Europe’s slowest growth pace in about a year. However, this represents a near-term pause rather than structural reversal. China still holds 53% EV market share, Norway 95%, and long-term projections show continued growth as battery costs decline and charging infrastructure expands. The decline reflects policy uncertainty and economic headwinds, not technology failure.
Q2. Why is India ranked so low in global EV adoption despite government targets? India ranks 47th out of 51 countries at 3.7% EV penetration because of the massive upfront cost premium — a Tata Nexon EV costs ₹6.5 lakh more than the petrol version, which middle-class buyers cannot justify despite lower running costs. Charging infrastructure remains limited (Karnataka leads with only 6,097 stations as of July 2025), and the government’s original 30% adoption target by 2030 has been revised down to realistic 10% estimate. However, two-wheeler EVs show stronger growth due to lower absolute prices, and battery-as-a-service models from MG Motor and Maruti may accelerate adoption in 2026.
Q3. Is renewable energy on track to meet COP28 tripling goal by 2030? No. Despite record 800 GW solar/wind installations in 2025 (tripling since 2021), the world still falls short of requirements. IRENA estimates 317 GW annual wind and 735 GW annual solar additions are needed through 2030. Even if every planned project with 2030 start year delivers on time, there’s a shortfall of 1 TW wind and 1.6 TW utility-scale solar. Moreover, Global Energy Monitor shows 40% of planned projects are late or cancelled. Current trajectory achieves 2.6x increase by 2030, not the 3x tripling commitment, making the goal mathematically unreachable without accelerated deployment beyond current plans.
Q4. What is causing the 2026 energy transition to fragment rather than accelerate? Three incompatible national priorities are fragmenting the transition: US subordinates climate to AI dominance, with policy reversals delaying emissions cuts 5 years despite economic fundamentals supporting renewables; China pursues manufacturing scale and export strategy with climate as side effect, having already peaked domestic oil demand from EV success; Europe prioritizes energy security through renewables following Russia gas shock. These divergent paths undermine global coordination needed for collective climate targets. As BloombergNEF notes, “it is no longer clear major economies are running the same race.”
Q5. Which country is leading the 2026 energy transition? China leads by every measurable metric — 390 GW solar (56% of global) and 86 GW wind (60% share) in 2026, more than the next six countries combined, plus 53% EV market share domestically and dominant export position. However, “leading” depends on definition: Norway achieves 95% EV adoption showing consumer readiness, Spain delivers 32% cheaper electricity from renewables demonstrating economic benefits, and India’s 97 GW solar with 500 GW 2030 target shows emerging market potential. China’s dominance is manufacturing scale, not climate ambition — the motivation is industrial competitiveness and energy security, not emissions reduction.
Q6. Will electric vehicles become mainstream by 2030? Regional outcomes will vary dramatically. China and Norway are already mainstream (53% and 95% respectively). Europe will likely reach 40-50% by 2030 based on current trajectory. US adoption depends entirely on policy stability — current hostile environment delays mainstream adoption to post-2030. India’s 10% realistic estimate by 2030 means EVs remain niche. The global average will reach approximately 30-35% of new car sales by 2030, but “mainstream” (>50% share) will only occur in advanced markets with strong policy support, affordable vehicles, and robust charging infrastructure — not globally.
My Take: What 15 Years Covering Energy Transitions Taught Me About Timelines and Political Will
I have been analyzing energy and climate markets for over fifteen years, and the 2026 reality check was inevitable. The triumphalist narrative of 2020-2023 — where every quarterly EV sales record and renewable capacity addition was extrapolated into exponential curves toward net-zero — ignored the messy political, economic, and human behavioral factors that have always determined energy transition timelines.
The most important lesson from 2026 is that technology readiness does not equal adoption readiness. Solar panels and batteries are cheaper than ever. EVs deliver superior performance to internal combustion engines. The economics work on spreadsheets. Yet India achieves only 3.7% EV penetration because middle-class families cannot afford the upfront premium, and the US automakers write down $55 billion because consumers hesitate when federal incentives disappear.
Energy transitions have always taken 50-70 years historically — coal to oil, oil to natural gas. The idea that we would complete a fossil-to-renewable transition in 20 years because “the technology is ready” was always naive. China’s 390 GW annual solar deployment is astonishing — but China also built that capacity by accepting debt levels, industrial overcapacity, and supply chain concentration that no other country can or will replicate.
The fragmentation we see in 2026 — US prioritizing AI, China pursuing manufacturing dominance, Europe seeking energy security — is actually more honest than the pretense of collective climate action that characterized the 2010s. Countries act in their perceived national interest. Climate goals get subordinated to economic and security priorities when the two conflict. That is not cynicism — that is observation.
However — and this is the critical counterpoint — the economic fundamentals now favor renewables so strongly that deployment continues even when policy turns hostile. The US installed 93% of new capacity as renewables through September 2025 despite an administration actively opposing clean energy. Spain’s electricity is 32% cheaper than the EU average because of solar and wind, creating political constituency for further deployment that fossil interests cannot overcome.
My honest view for 2026 and beyond: the energy transition will continue but at a pace determined by economics, not ambition. Solar and wind will dominate new electricity generation because they are cheapest. EVs will reach mainstream adoption in wealthy markets by 2030 and emerging markets by 2040, not because of targets but because total cost of ownership favors them once battery costs decline another 30-40%. Green hydrogen will remain marginal until 2035 because the economics do not work at scale yet.
That is not failure — that is reality. The question is whether this economically-driven transition pace is fast enough to avoid catastrophic climate outcomes. The data increasingly suggests it is not. But acknowledging that gap is the first step toward designing policies that might actually close it.
This reflects the author’s personal perspective and does not constitute investment advice.
Conclusion
The 2026 EV and sustainable energy transition is delivering a reality check that separates technology potential from adoption reality. Global EV sales declined 3% in January 2026 despite long-term structural drivers remaining intact, while renewable energy surged to record 800 GW installations yet still falls short of COP28 tripling commitments. India’s 47th global ranking at 3.7% EV penetration despite 30% government targets demonstrates the gap between policy ambition and affordability constraints, while China’s 390 GW annual solar deployment (56% of global capacity) highlights the geopolitical fragmentation that now defines the transition more than collective climate action.
The energy transition is not failing — but it is fragmenting into incompatible national strategies driven by economic competition, energy security, and technological dominance rather than coordinated climate response. Solar and wind will continue displacing fossil fuels because the economics are simply too compelling, delivering electricity 32% cheaper in Spain than the EU average and dominating 93% of US capacity additions despite hostile policy. Electric vehicles will reach mainstream adoption in wealthy markets by 2030 and emerging markets by 2040, driven by declining battery costs and total ownership economics rather than government mandates.
The investors, policymakers, and citizens who understand that the transition’s pace will be determined by economic fundamentals rather than climate urgency will make better decisions than those waiting for political will to align with scientific necessity. That is not pessimism — that is the reality that 2026’s data is making im